OLYMPEX
Science Summary for 1 November 2015
Postfrontal Convective Rain and Snow
Prepared by
Robert A. Houze, Jr., Lynn McMurdie, and Joe Zagrodnik
NOTES:
The date starts at 0000 UTC.
This report may be updated as new information becomes available.
Data discussed here were compiled in near real time and have not yet been quality controlled.
Updated reports can be found at http://olympex.atmos.washington.edu/index.html?x=Science_Summaries
|
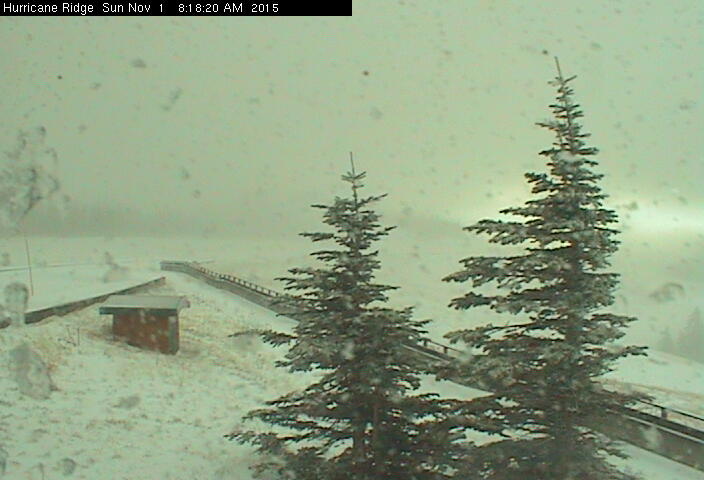
Postfrontal precipitation occurred throughout
this day. Figure 1 shows snow
falling at the Hurricane Ridge site on the lee side of the
Olympic Mountains. At 500 hPa, three identifiable short
wave troughs were embedded in the broader trough passing
from west to east across the region (Figure
2a). The 500 hPa temperatures were low (Figure 2b), consistent with the unstable
condition seen in the lower troposphere in the Quillayute
sounding taken at 1200 UTC (Figure 3).
It was especially unstable below 700 hPa. The IR satellite
sequence in Figure 4 shows the
postfrontal convective cloud regime moving over the
Olympic Peninsula throughout the day. In the 0500 UTC
image (upper right), cloud features can be seen that
correspond to the three short wave troughs in Figure
2a. The sequence of radar images in Figure 5 shows that the convection
passing over the region had mesoscale dimensions, and
toward the end of the day was organized in to
southwest-northeast bands. Lightning was detected in these
convective features, as shown in Figure
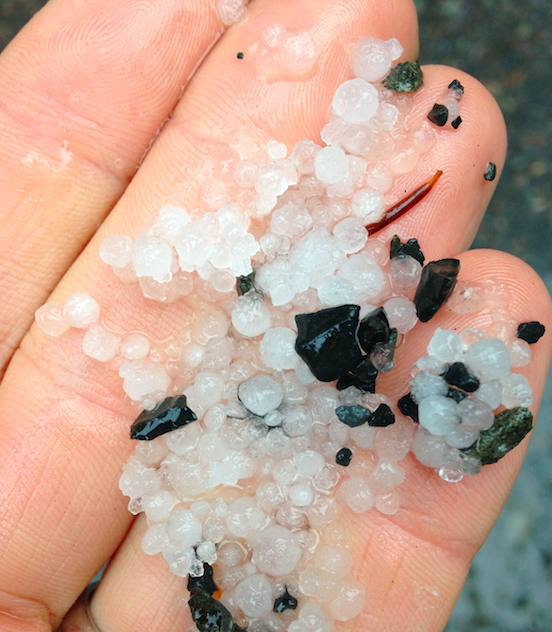
6. Lightning was also seen by the OLYMPEX ground
crew both near Lake Quinault and over the Wynoochee site.
They also observed graupel mixed with the rain on the
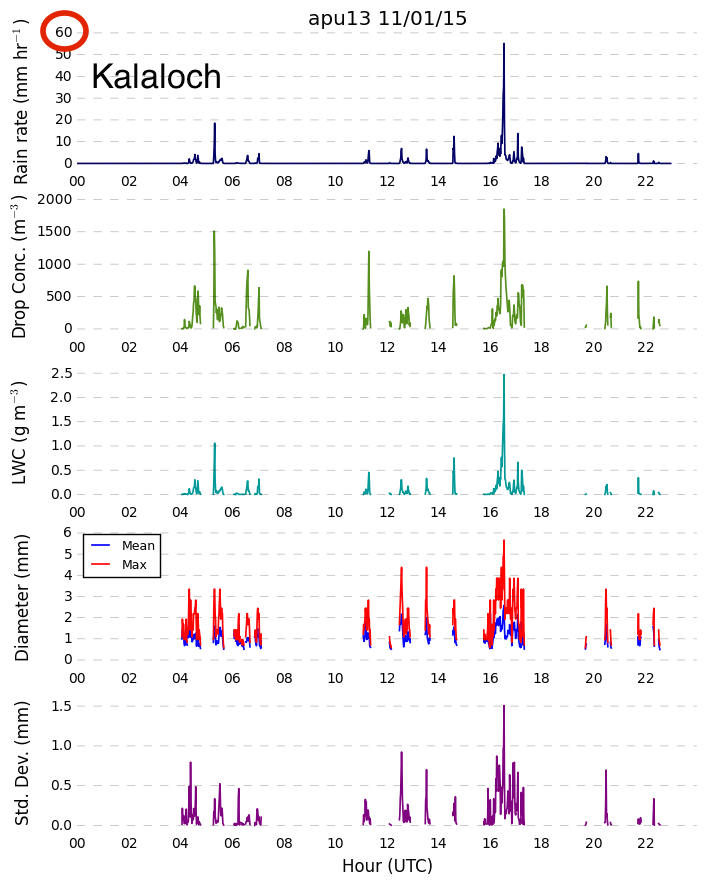
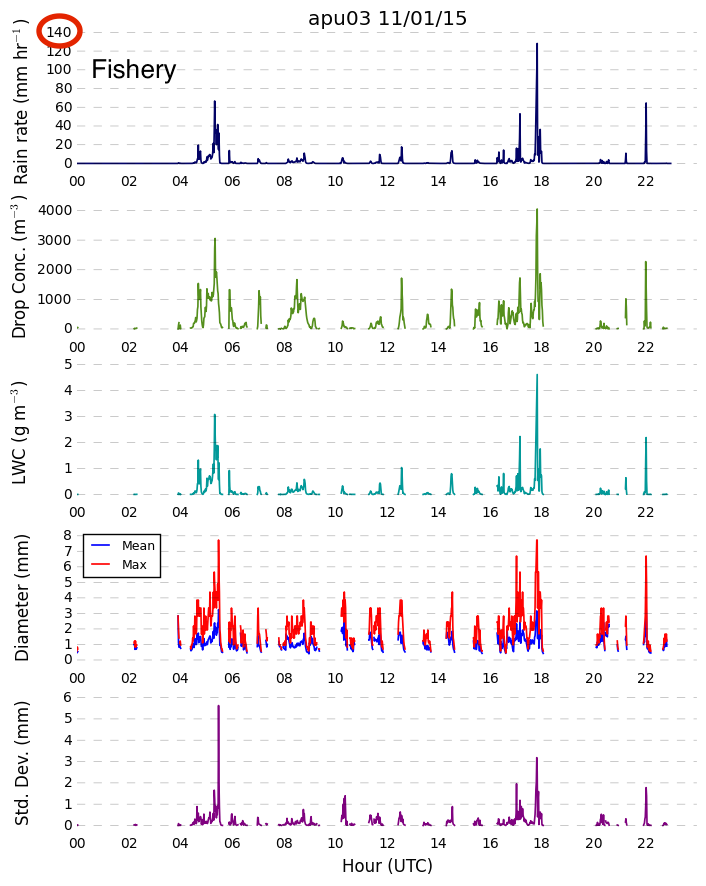
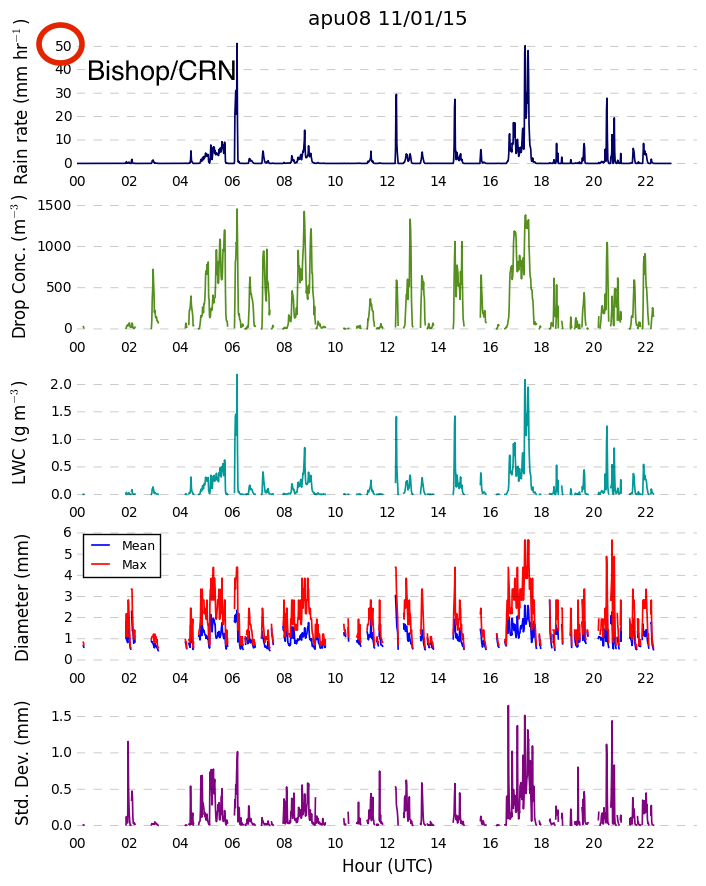
ground at Wynoochee (Figure 7). The
showery character of all the precipitation is illustrated
by the Parsivel data from three sites in Figure 8. |
(a)
(b)
|
Figure 2.
500 hPa
height with
(a) vorticity and (b)
temperature
and wind at 1800 UTC 1
November 2015.
|
|
Figure 3.
Quillayute souding, 1200 UTC 1
November 2015.
|
|
Figure 4
.Sequence of
infrared images for 0000, 0500, 0900, 1300 UTC 1
November 2015.
|
|
Figure 5. Sequence of Langley radar
reflectivity images for 1 November 2015. Time
are UTC.
|
|
Figure 6.
Lightning at 1630 UTC 1 November 2015, superimposed
on IR image.
|
|
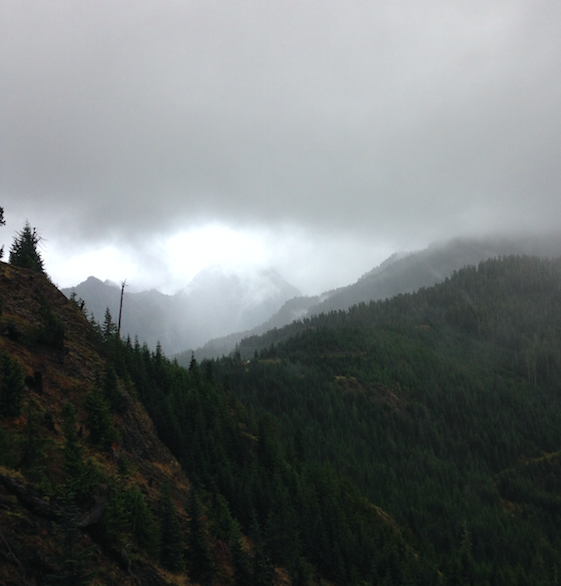
Figure 7.
Graupel observed mixed with rain at Wynoochee (~1 km
elevation) and snow shower seen from Wynoochee at
~2100 UTC 1 November 2015.
|
|
Figure 8.
Parsivel data for 1 November
2015 at Kalaloch
on the coast north of the Quinault, the Fishery
site slightly inland in the Quinault Valley,
and the
Bishop site on the east end of Lake Quinault.
|