OLYMPEX
Science Summary for 12 November 2015
OLYMPEX Aircraft and Radars Observe Warm Moist Prefrontal Flow
Impinging on the Olympic Mountains
Prepared by
Robert A. Houze, Jr., Stephen Rutledge, Lynn McMurdie, Walt Petersen, Kristen Rasmussen,
Angela Rowe, and Joe Zagrodnik
NOTES:
The date starts at 0000 UTC.
This report may be updated as new information becomes available.
Data discussed here were compiled in near real time and have not yet been quality controlled.
Updated reports can be found at http://olympex.atmos.washington.edu/index.html?x=Science_Summaries
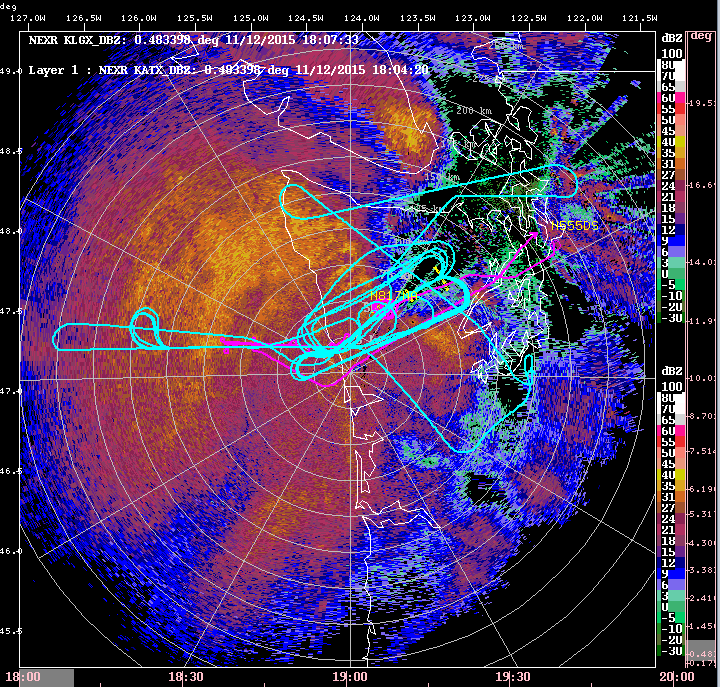
| This day was the fullest day of
operation for OLYMPEX. The NPOL radar, DC8, and
Citation aircraft all were in use, and the
weather consisted of a major Pacific Northwest
rainfall event with orographic enhancement over
the Olympic Mountains. The flight tracks of the
DC8 and Citation are shown in the left panel of
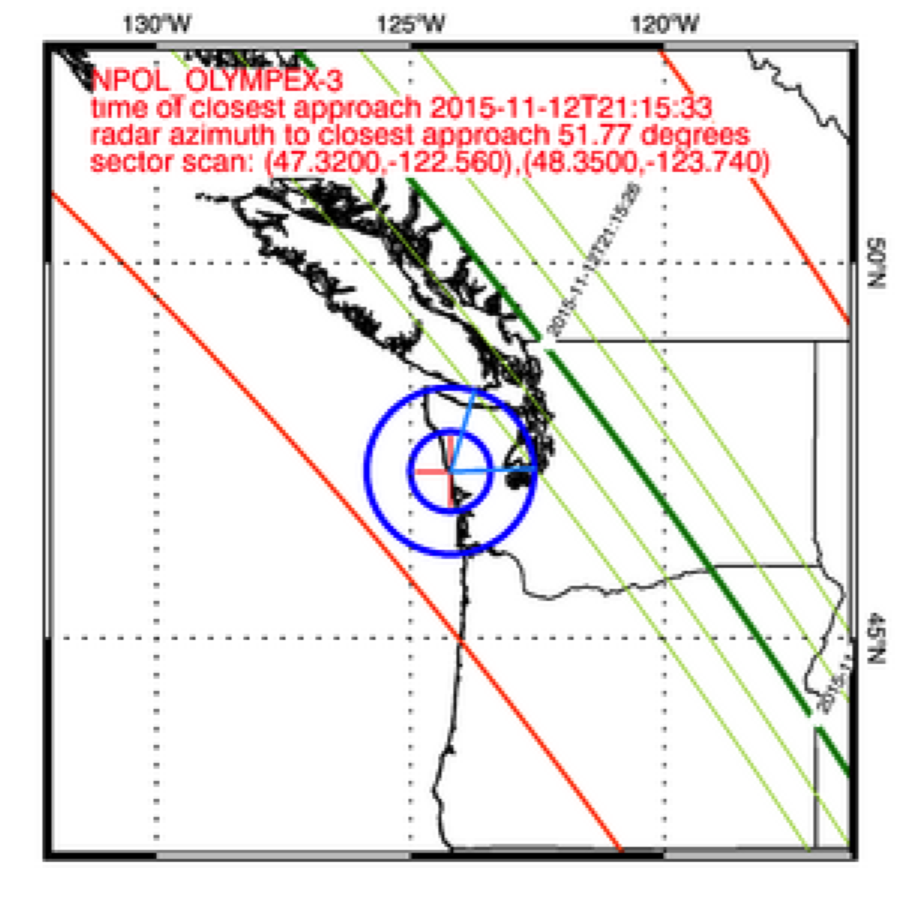
Figure 1. Also note
from Figure 1 that
the flights occurred at the time of a GPM
overpass. The DC8 flew to the west and launched
two dropsondes to document upstream conditions.
Both aircraft flew multiple tracks in the
Quinault Valley region. The Citation
accomplished a spiral pattern documenting the
microphysics in the region covered by the DOW
radar. The synoptic conditions consisted of
westerly winds at the exit of a strong zonal jet
over the Pacific at 500 hPa (Figure 2 left) and
southwesterly flow of warm moist air into the
Olympic Mountains at 850 hPa to the surface (Figure 2 right, Figure 3). The front was
far to the northwest, and the OLYMPEX region
thus lay in the warm air ahead of the front
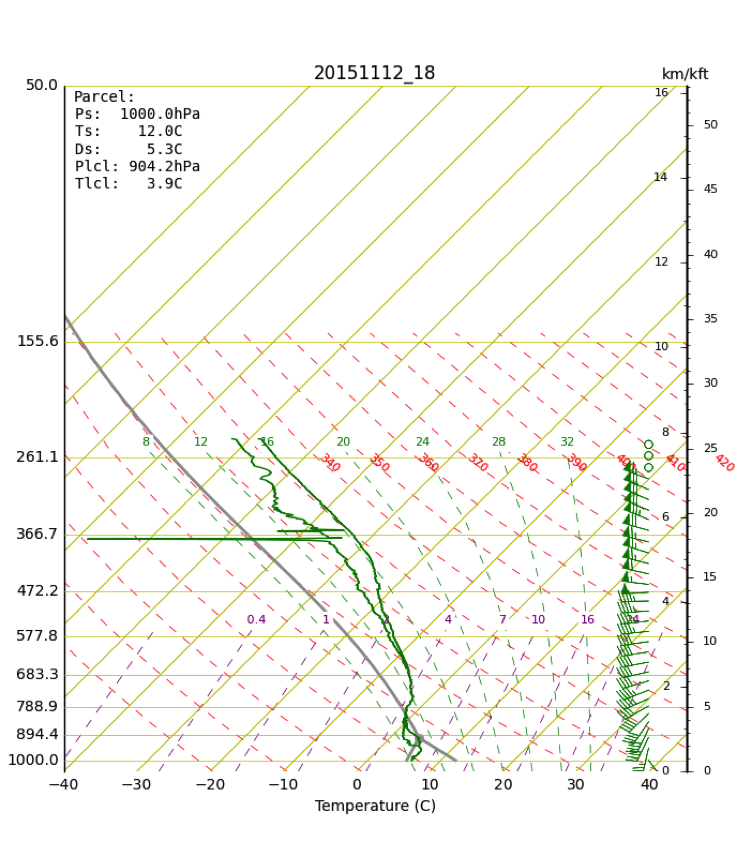
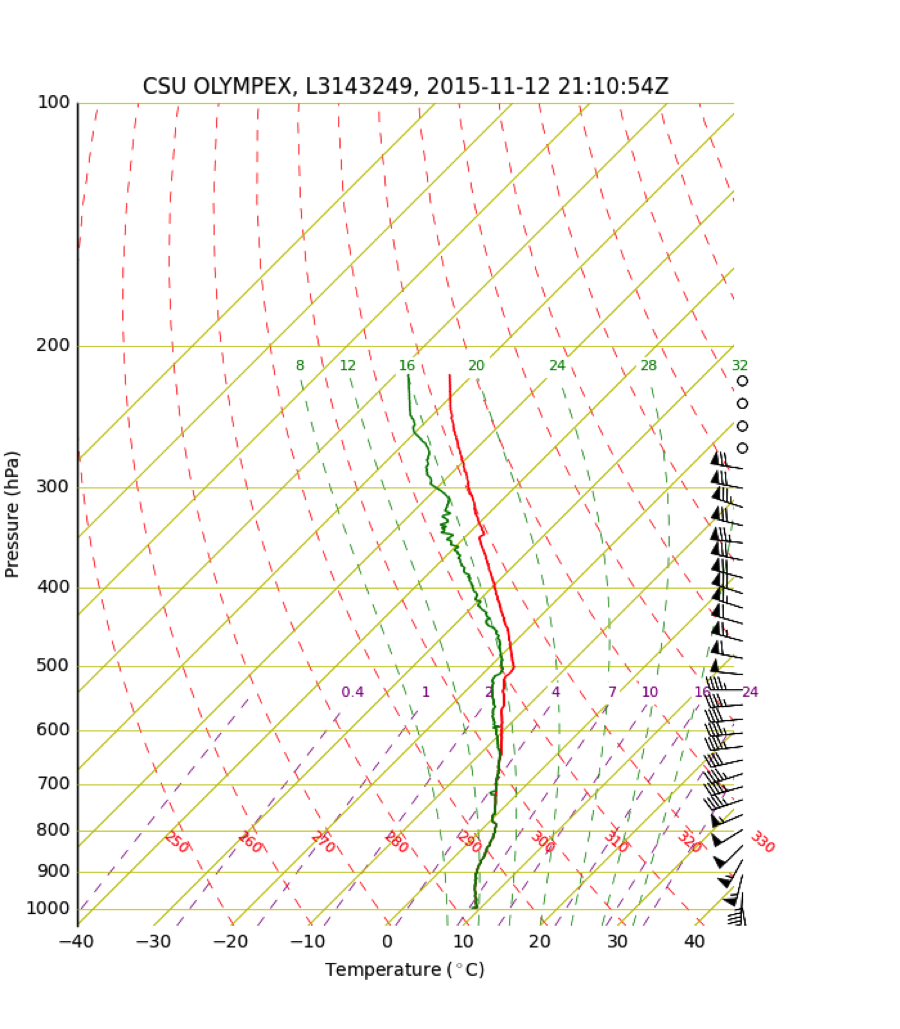
during the entire 24 h period. Soundings taken
at the NPOL site showed that the incoming flow
was stable as well as moist and warm, up to
about the 400 hPa level (Figure
4). Figure 5 shows a
time series of the winds and radial velocity at
Quillayute as seen by a 449 MHz wind profiler.
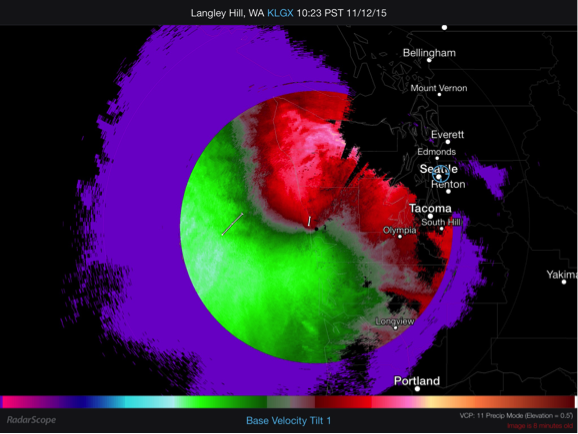
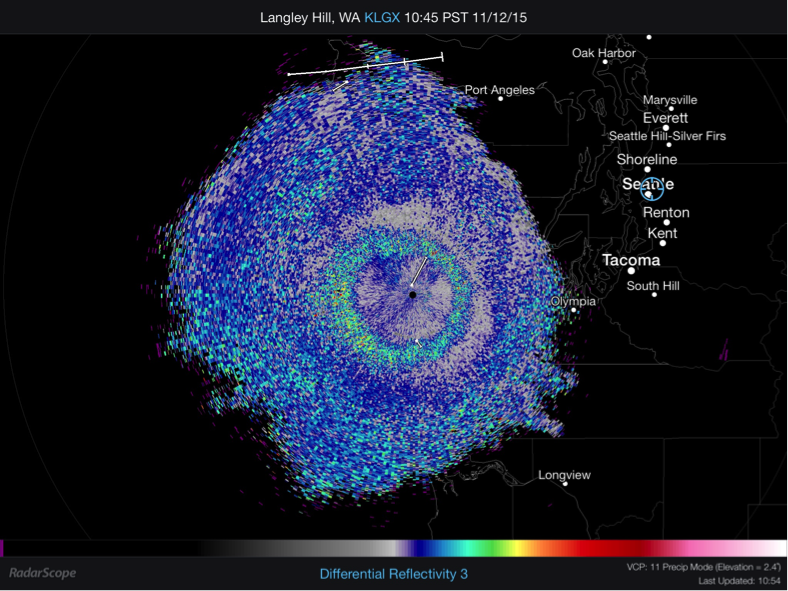
The veering winds in the lower levels produce a
classic S-pattern in the radial velocity PPI of
the Langley radar (Figure 6).
The geosynchronous infrared imagery shows how
the frontal cloud band lay to the west-southwest
of the Olympic Peninsula during the whole 24 h
period (Figure 7). Note the
pronounced rain shadow (absence of cloud) on the
northeast (leeside) of the Olympic Mountains.
The Langley radar PPIs and vertical cross
sections (Figure 8) showed that the
radar echo in the rain zone was strongest below
about 3 km and had an internal cellularity. The
lack of bright band in these images is a result
of interpolating widely spaced elevation angles.
The bright band was evident in PPIs of specific
elevation angle (e.g. Figure
9). Note that a secondary reflectivity
maximum occurred a higher level, probably due to
aggregation in the dendritic growth layer. This
feature was also seen on other radars and in
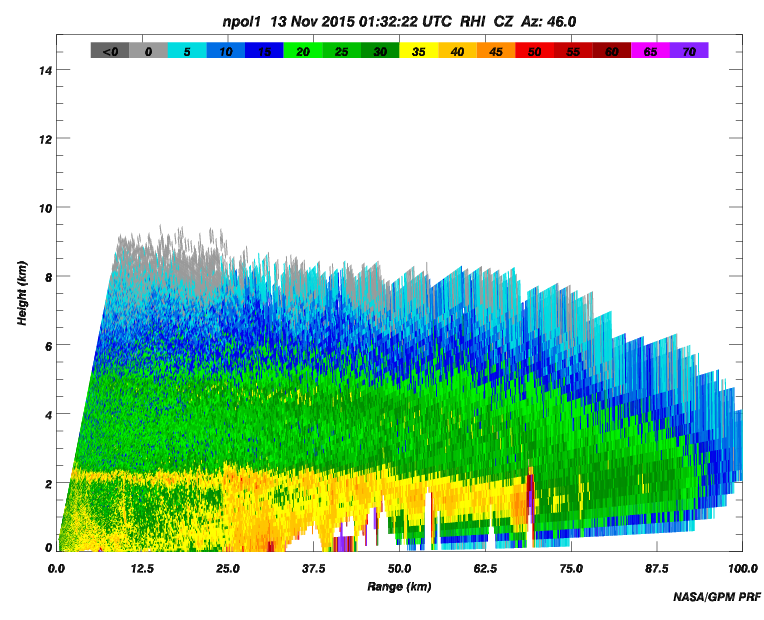
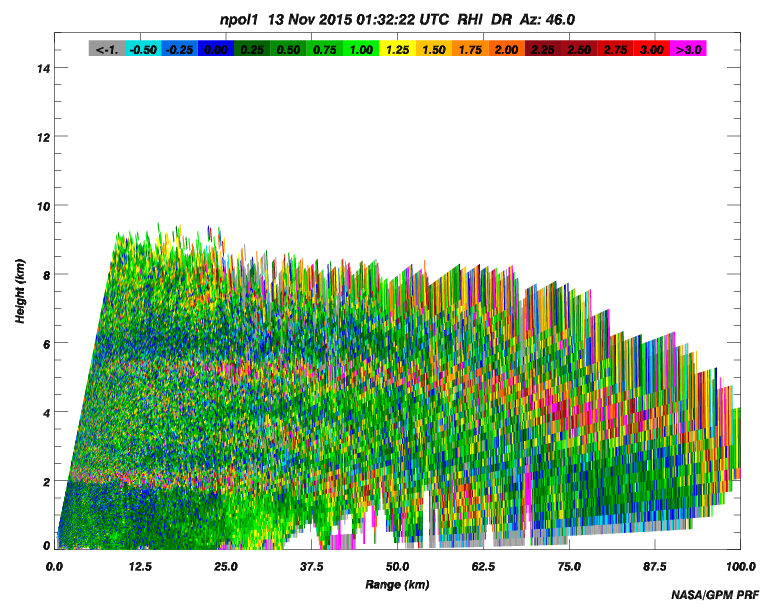
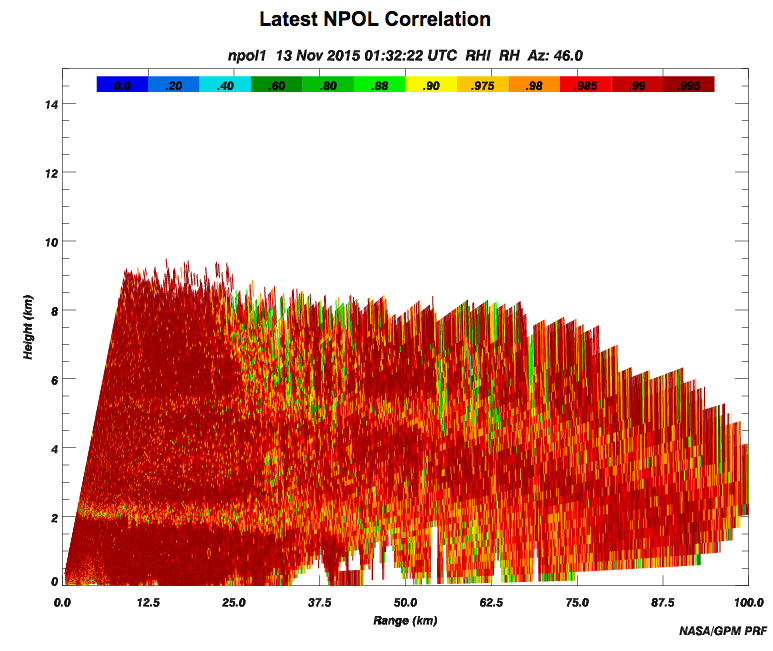
dual-polarimetric variables. For example, the NPOL
radar data in Figure
10 show the secondary maximum about 2 km
above the bright band in the patterns of ZDR and
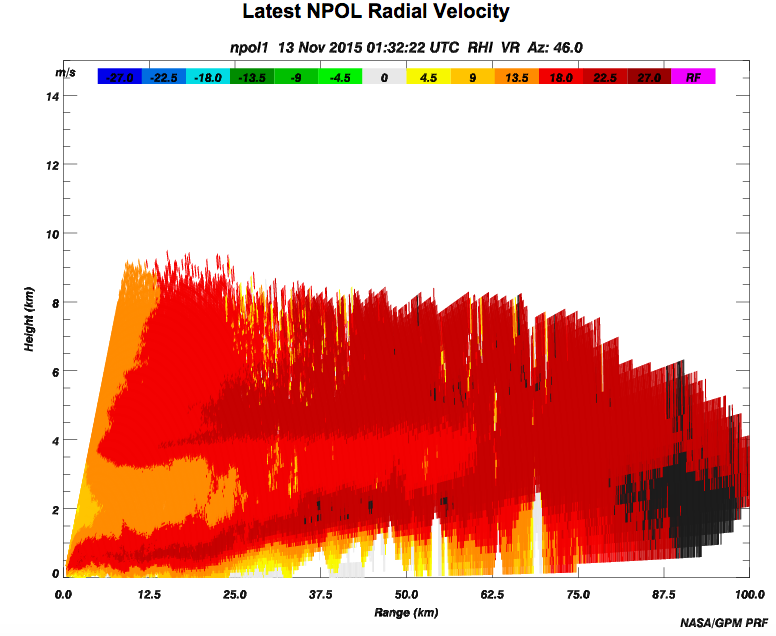
rhohv as well as in the reflectivity. Another significant
feature is in the radial velocity RHI
in the lower right of Figure 10, which
shows the core of maximum cross-barrier
wind
rising even before reaching
the terrain,
consistent with
the mountain
barrier having
an
upstream
influence in the
enhancement of
the condensation
and
precipitation.
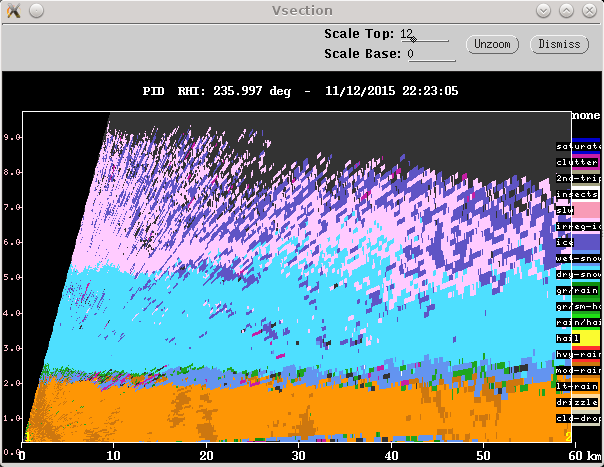
Figure 11
shows a first attempt to calculate
the predominant particle type seen by
the NPOL radar data. The
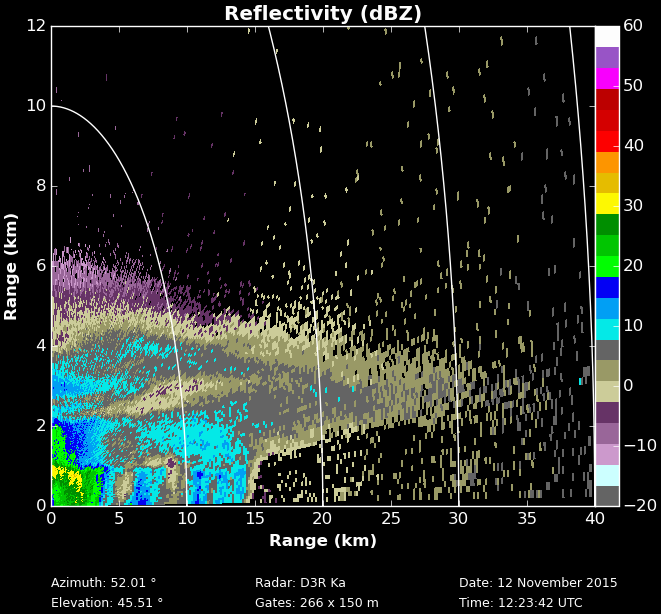
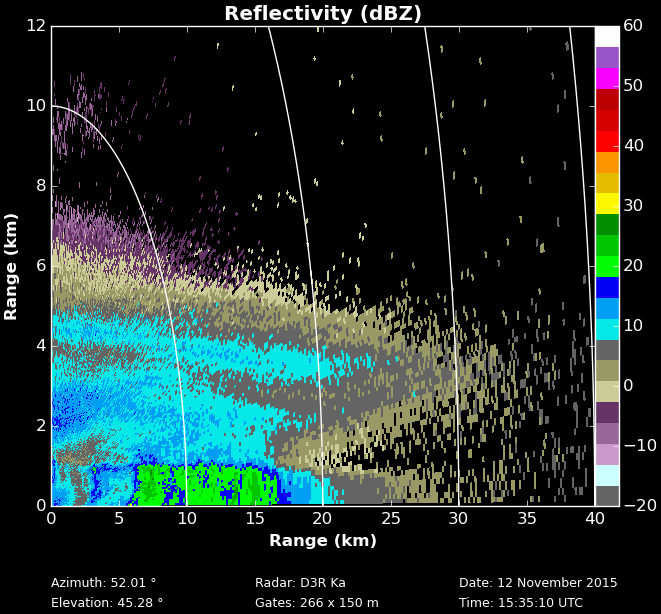
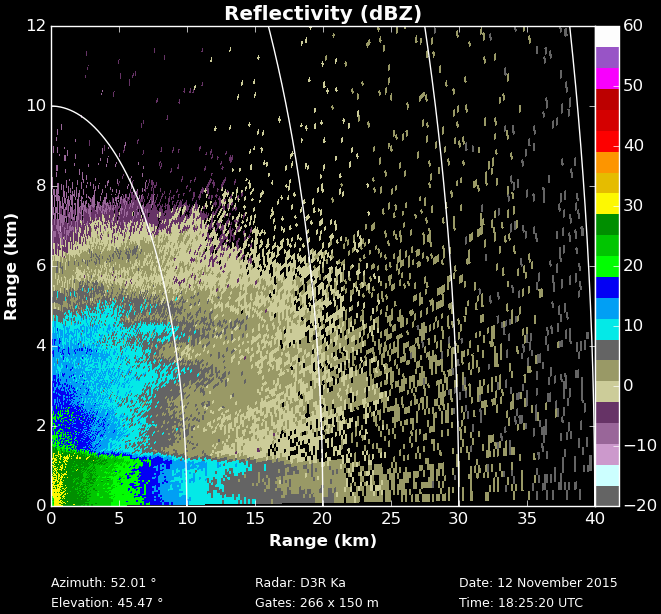
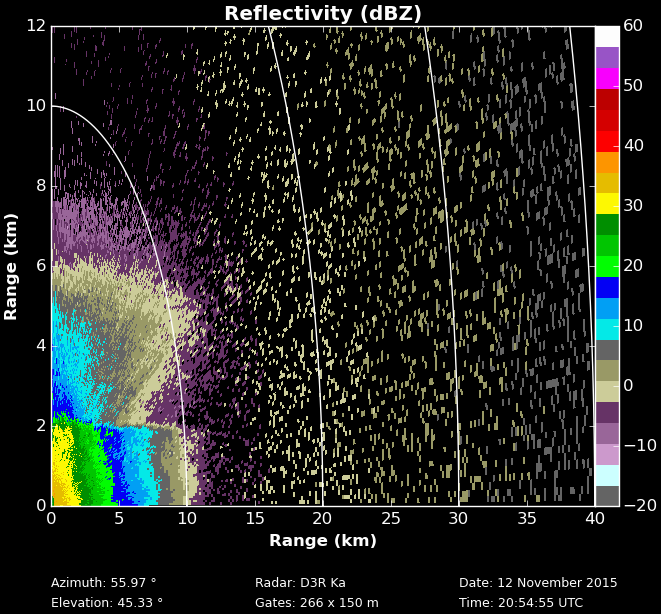
Ka-band reflectivity seen by D3R showed the
upper level echo as the frontal system moved in
(Figure 12, upper left). It
shows layering of the precipitation that is
classic stratiform in character, with
smaller non-oriented ice particles
at high levels, larger ice in
the layer above the bright band, large
melting snowflakes in the
bright band, with some indications
of possibly graupel in places near the top of
the bright band, and rain in the
lower layer. When the most intense
rainfall was present, the D3R echo
extended up to about 8 km (Figure 12, lower
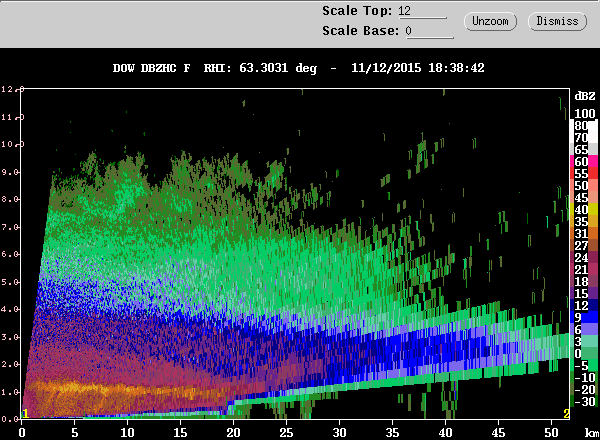
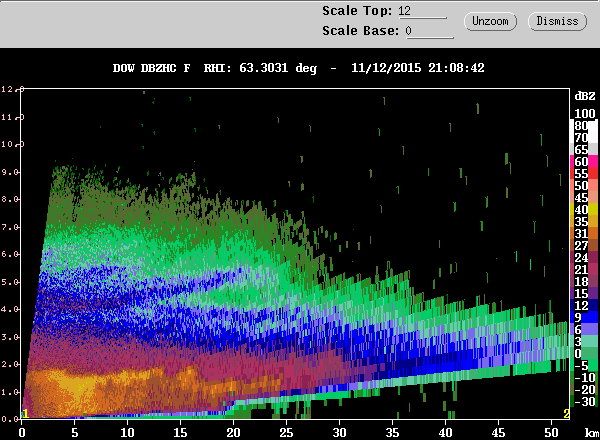
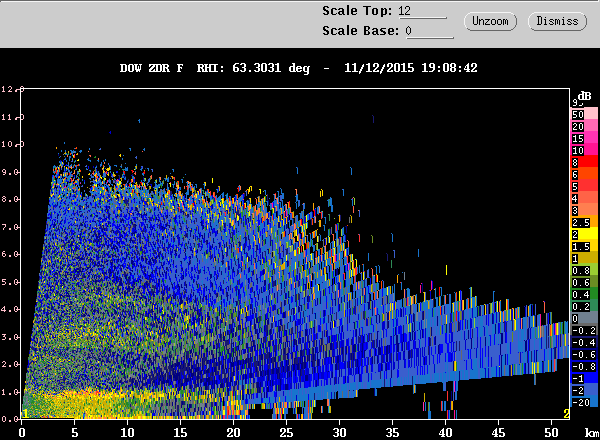
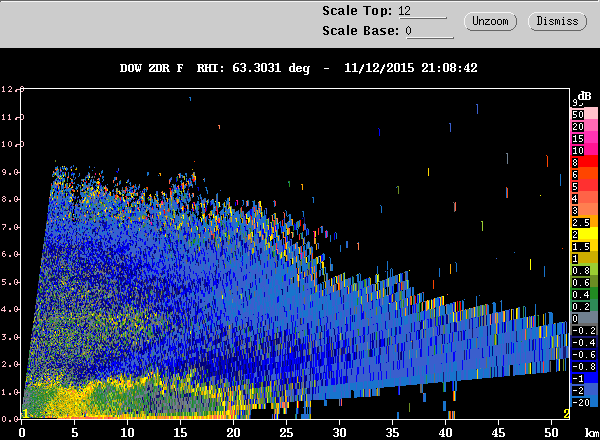
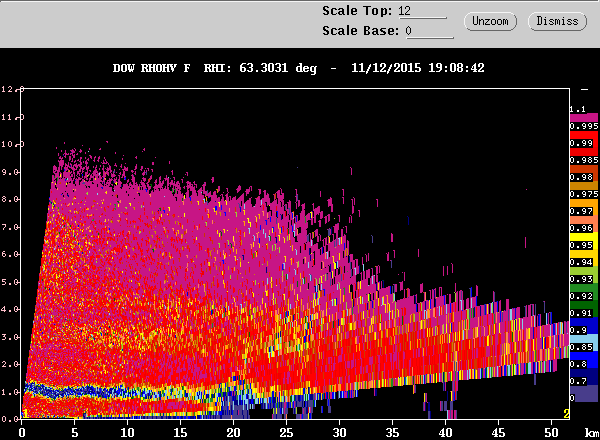
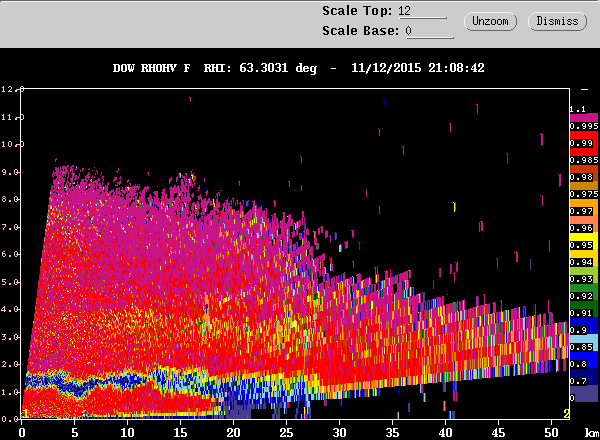
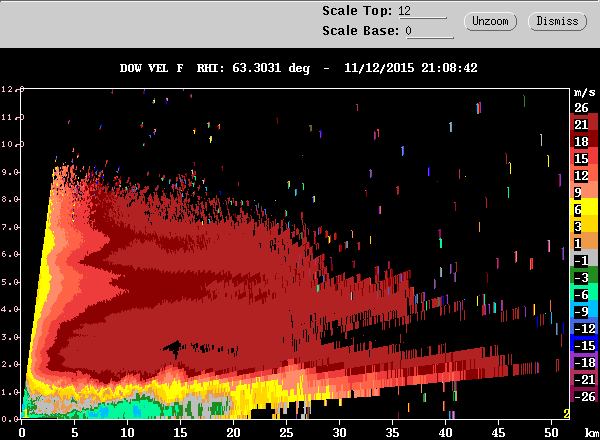
left). The DOW radar (Figure 13)
looking up the Quinault Valley
also showed the secondary maximum
above the bright band in ZDR and
rhohv. The two times shown in Figure 13 were
during the flights (Figure 1,
left) and GPM overpass (Figure 13,
right). Note how the bright band
and secondary maxima bend downward
over the mountain slope—a feature
that has been noted before in this
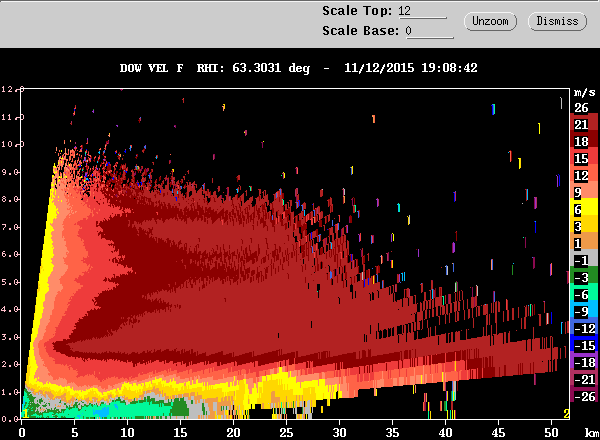
type of precipitation. An
important discovery in the DOW
data is the occurrence of
down-valley flow at low-levels
shown by the radial velocity data
in the bottom panels of Figure 13. This
feature has been seen in the
Italian Alps in the Mesoscale
Alpine Programme and in the
British Columbia Rockies but has
not previously been documented to
occur in the Olympic Mountains.
There is a layer of very strong
shear between the top of this
down-valley flow and the strong
cross-barrier westerlies at higher
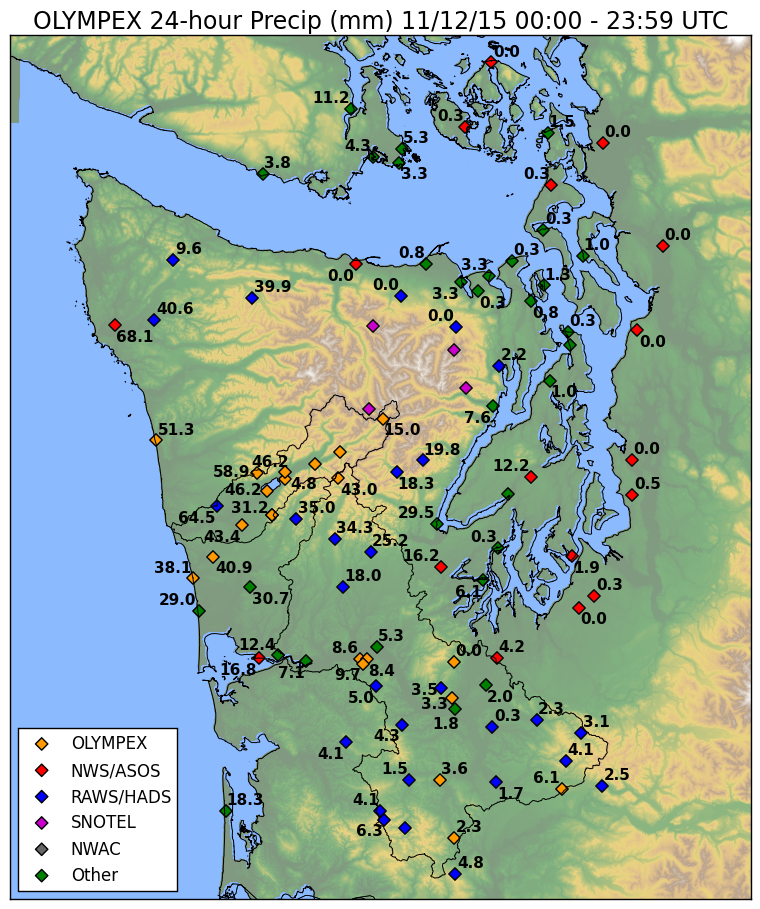
levels. The rainfall amounts in
the Quinault region (Figure 14)
were generally between 20 and 50
mm. Not that on the leeside the
amounts were zero, consistent with
the strong rain shadow seen in the
satellite data (Figure
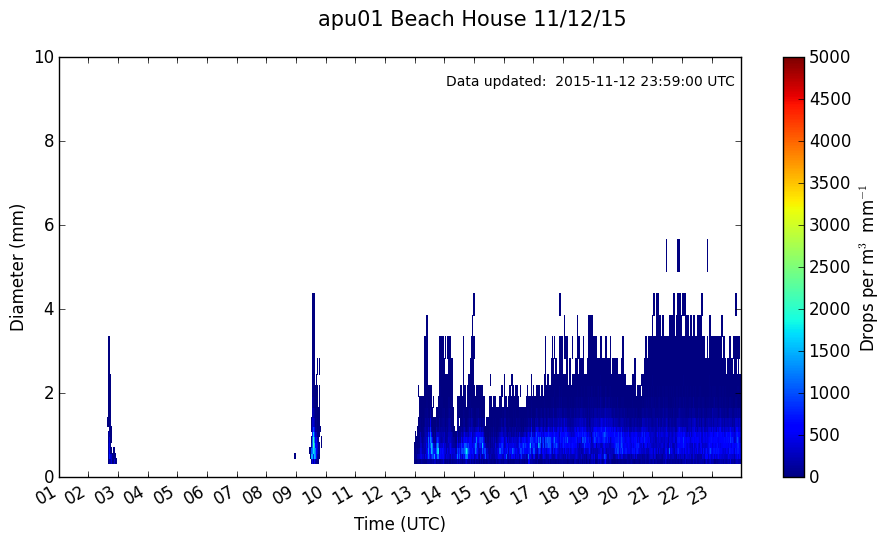
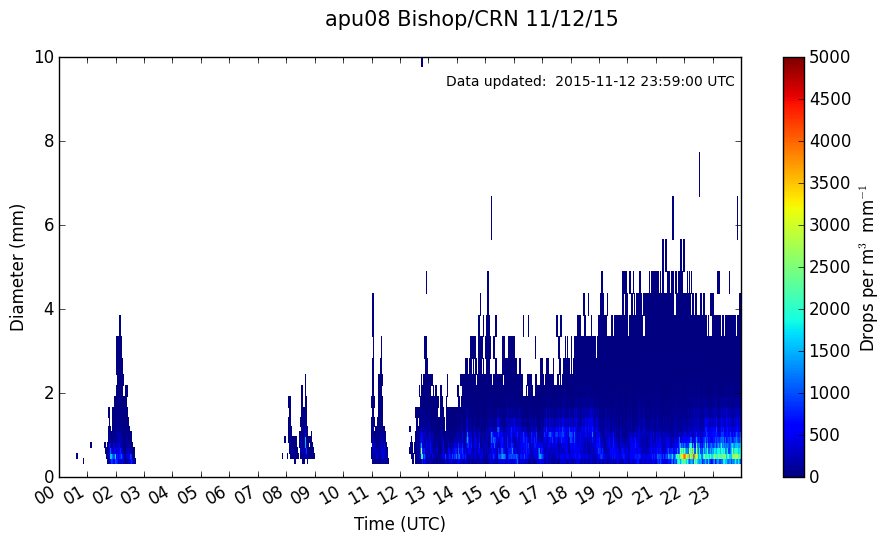
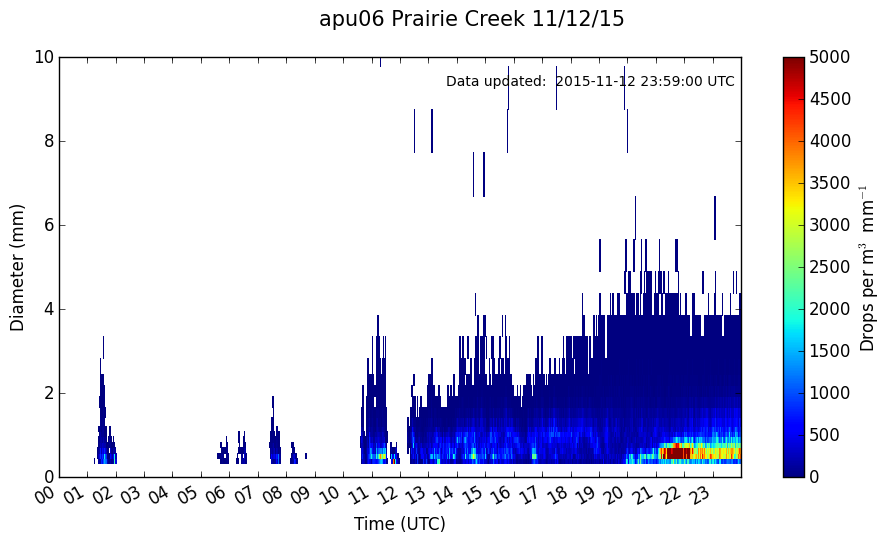
7). The drop sizes at the
surface stations tended to be much
larger than in recent days (Figure 15).
Small drops began to be more
common at the inland sites later
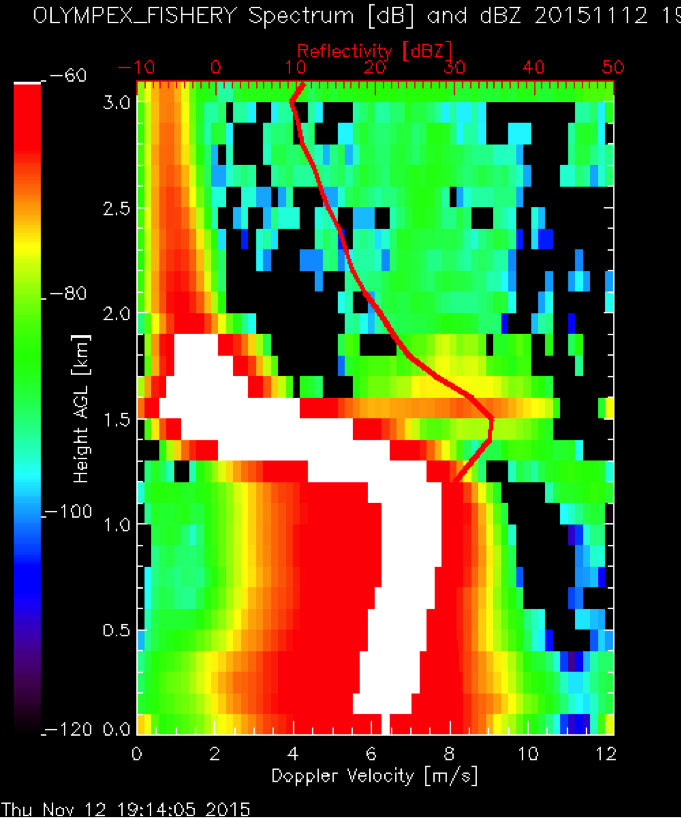
in the 24-h period. The Doppler
spectrum of fall velocities (Figure 16)
was typical of stratiform
precipitation, with a wide
spectrum of fall velocities,
mostly 4-8 m/s, at low levels and
a narrow spectrum of velocities of
~1 m/s above the melting level.
The Citation scientists
noted pristine stellars at
-13C and low liquid water contents
in the upper portions of the radar
echoes seen at DOW.
|
|
Figure 1.
Left panel: Flight tracks of DC8 (cyan) and Citation
(pink) aircraft on 12 November 2015, superimposed on the Langley
radar echo at 1804 UTC. Right panel: GPM
overpass during the flights.
|
|
Figure 2. Geopotential
height, temperature, and wind at the 500 (left) and
850 hPa level sat 1200 UTC 12 November 2015
|
|
Figure 3
Surface 2
m temperature, 10 m winds, and sea-level pressure
at 1200 UTC 12 November 2015.
|
 |
 |
|
Figure 4
Soundings at
NPOL site at 1800 and 2100 UTC 12 November 2015.
|
|
Figure 5.
Radial
(vertical) velocity and wind from the ESRL/PNNL
wind profiler at Quillayute,
12 November 2015.
|
|
Figure 6.
Warm
advection shown by the classic S-pattern in the
PPI of radial velocity observed by
the Langley radar at 1023 PST.
|
 |
 |
|
Figure 7.
Infrared
satellite imagery at 1500 (left) and 1900 UTC 12
November 2015.
|
 |
 |
 |
 |
|
Figure 8.
Langley radar
reflectivity superimposed on infrared
satellite imagery on 12 November
2015. Cross sections are along the
black lines in the left panels.
|
|
Figure 9.
Langley radar
reflectivity on 12 November
2015. Inner ring is the
bright band. A secondary
maximum is at a higher level, probably in
a layer of
dendritic growth and ice particle
aggregation
|
 |
 |
 |
 |
|
Figure 10.
NPOL
radar
data for 0132 UTC 13
November 2015. Top row:
reflectivity (left) and ZDR. Bottom
row: correlation
and radial
velocity
|
|
Figure 11.
Particle
identification algorithm results for NPOL
radar
data for2223 UTC 12
November 2015.
|
 |
 |
 |
 |
|
Figure 12.
D3R radar
reflectivity in an
RHI scan pointing toward the
Quinault Valley
between 1200 and 2100 UTC 12
November 2015.
|
 |
 |
 |
 |
 |
 |
 |
 |
|
Figure 13.
DOW radar
reflectivity in
RHI scans pointing northeastward up
the Quinault River Valley at
1900
(left) and 2100 UTC 12 November 2015.
|
|
Figure 14.
24-h
precipitation accumulation map for 12 November 2015.
|
   |
|
Figure 15.
Raindrop
size
distributions
for 12 November 2015.
|
|
Figure 16.
Doppler
velocity spectrum at the Fishery site MRR
at
1914 UTC 12 November 2015.
|