OLYMPEX
Science Summary for 13 November 2015

Huge Rain Accumulations in the Mountains in the Warm Prefrontal Regime
Followed by a Narrow Cold Frontal Rainband
Prepared by
Robert A. Houze, Jr., Angela Rowe, Kristen Rasmussen, Simone Tanelli, and Joe Zagrodnik
NOTES:
The date starts at 0000 UTC.
This report may be updated as new information becomes available.
Data discussed here were compiled in near real time and have not yet been quality controlled.
Updated reports can be found at http://olympex.atmos.washington.edu/index.html?x=Science_Summaries
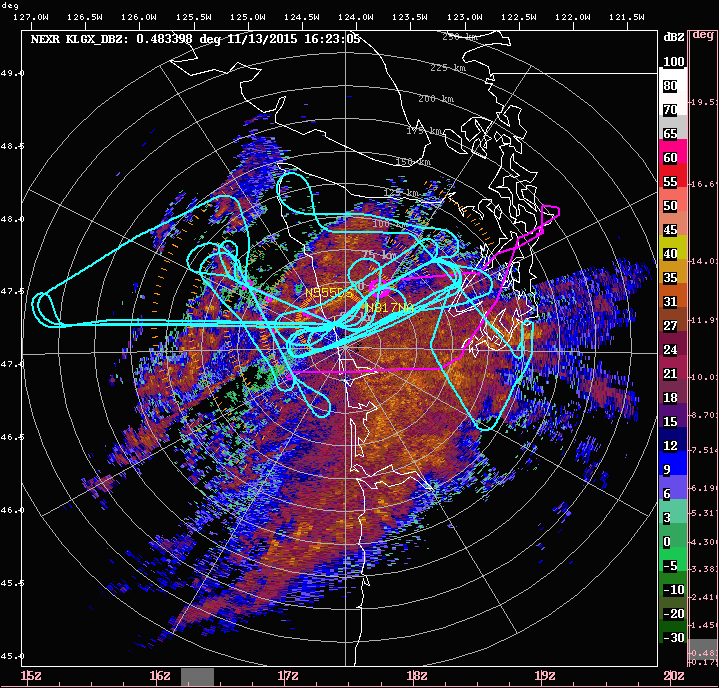
| An enormous amount of rain fell on the
windward side of the Olympic Mountains as the
prefrontal warm air very slowly moved across
the region. A narrow cold frontal rainband
marked the end of the main rainy period. In Figure 1, the
prefrontal precipitation is mainly to the east
of NPOL and the frontal band is to the east.
More details of these features will be
described below. The DC8 and Citation flying
between 1400 and 2000 UTC sampled both the
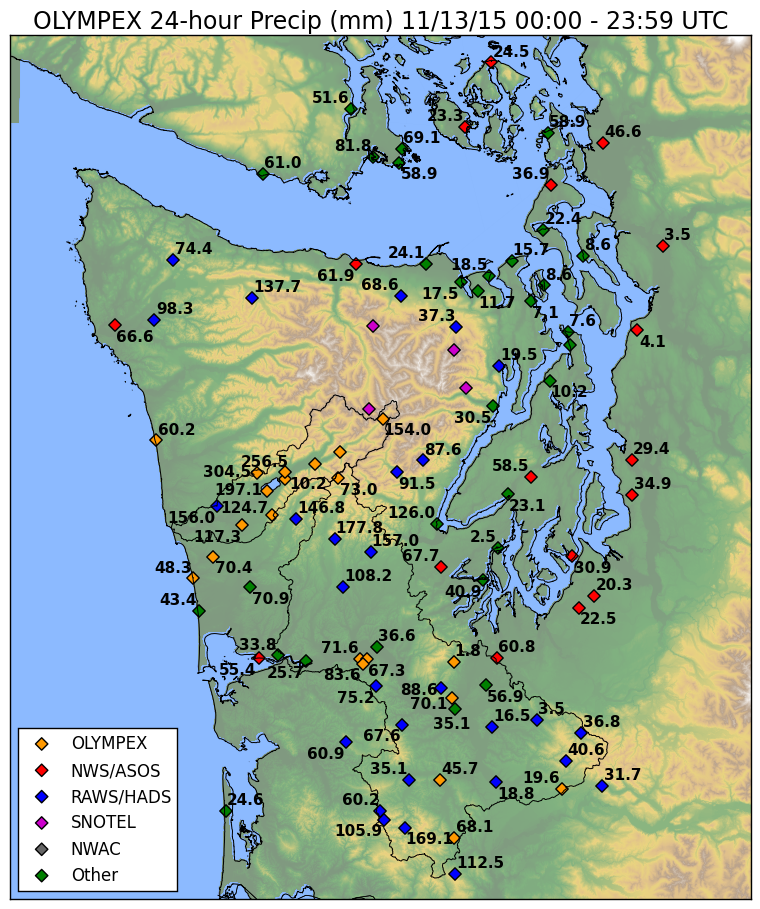
prefrontal and frontal zones (tracks in Figure 1). Figure 2 shows the
great amounts of rain that fell in the 24-h
period of 0000-2359 UTC 13 November. Note that
these were maximum in the Quinault valley,
where amounts were between 100 and 300 mm.
These were in addition to the 50-100 mm in the
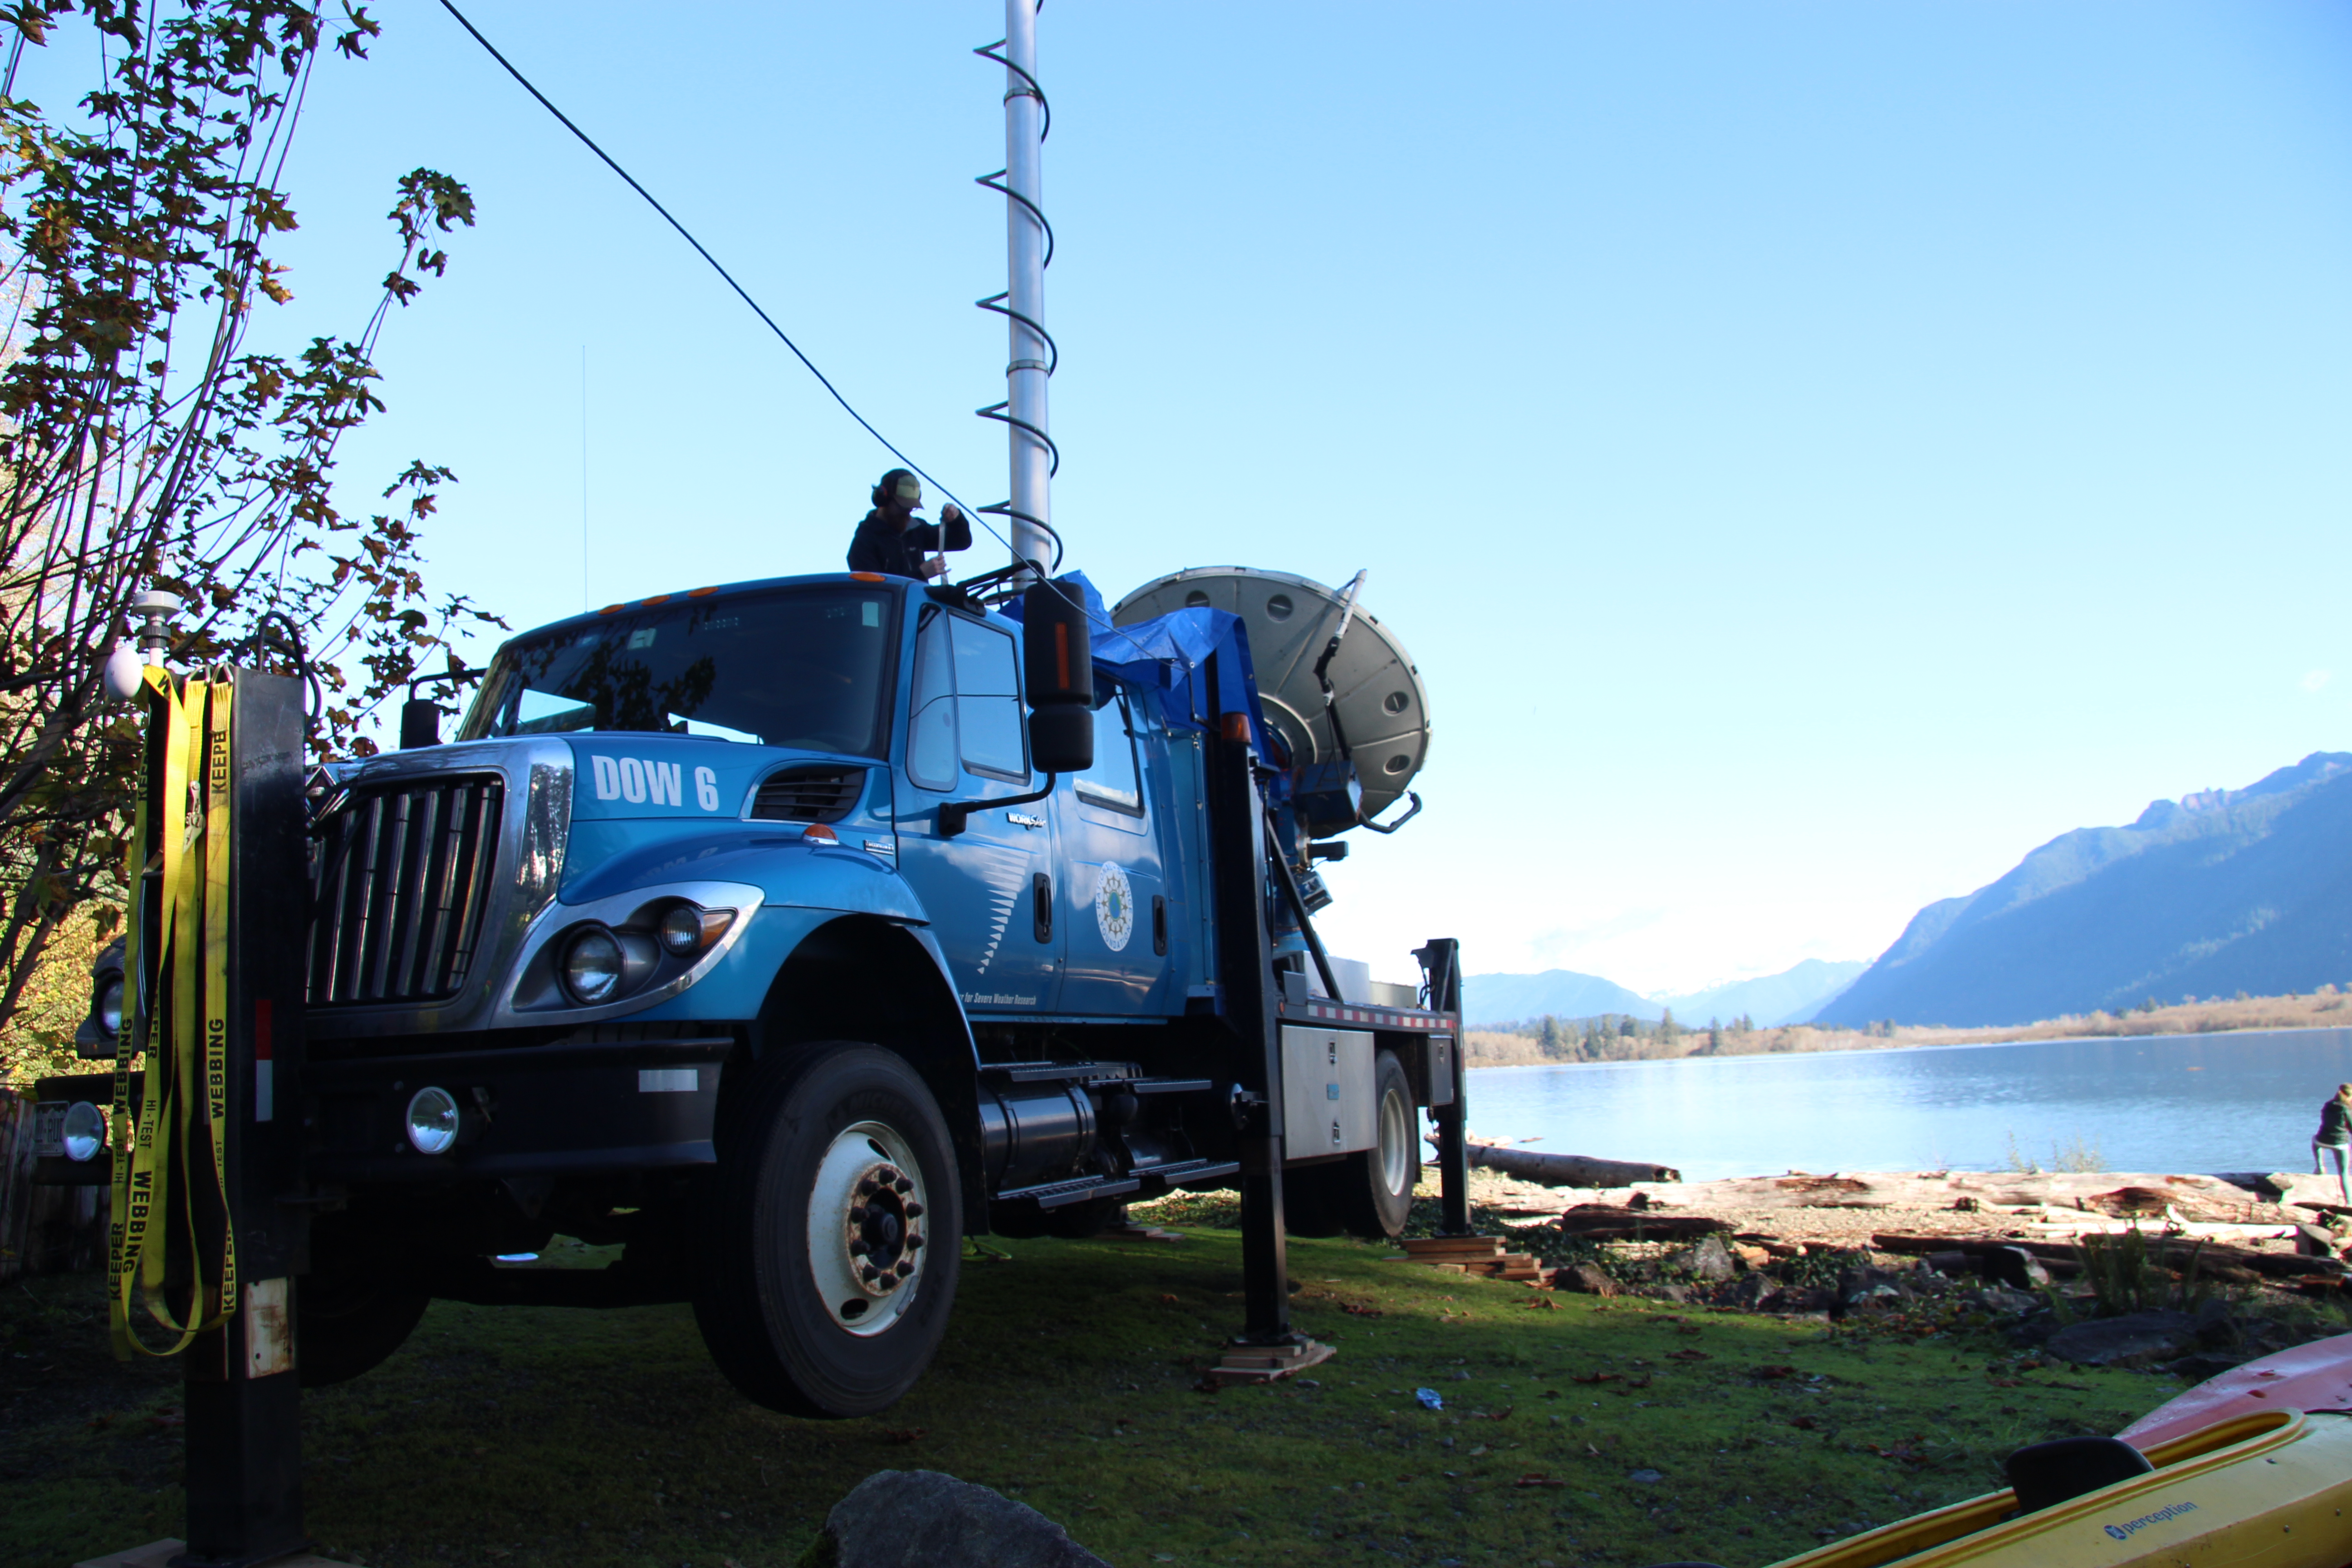
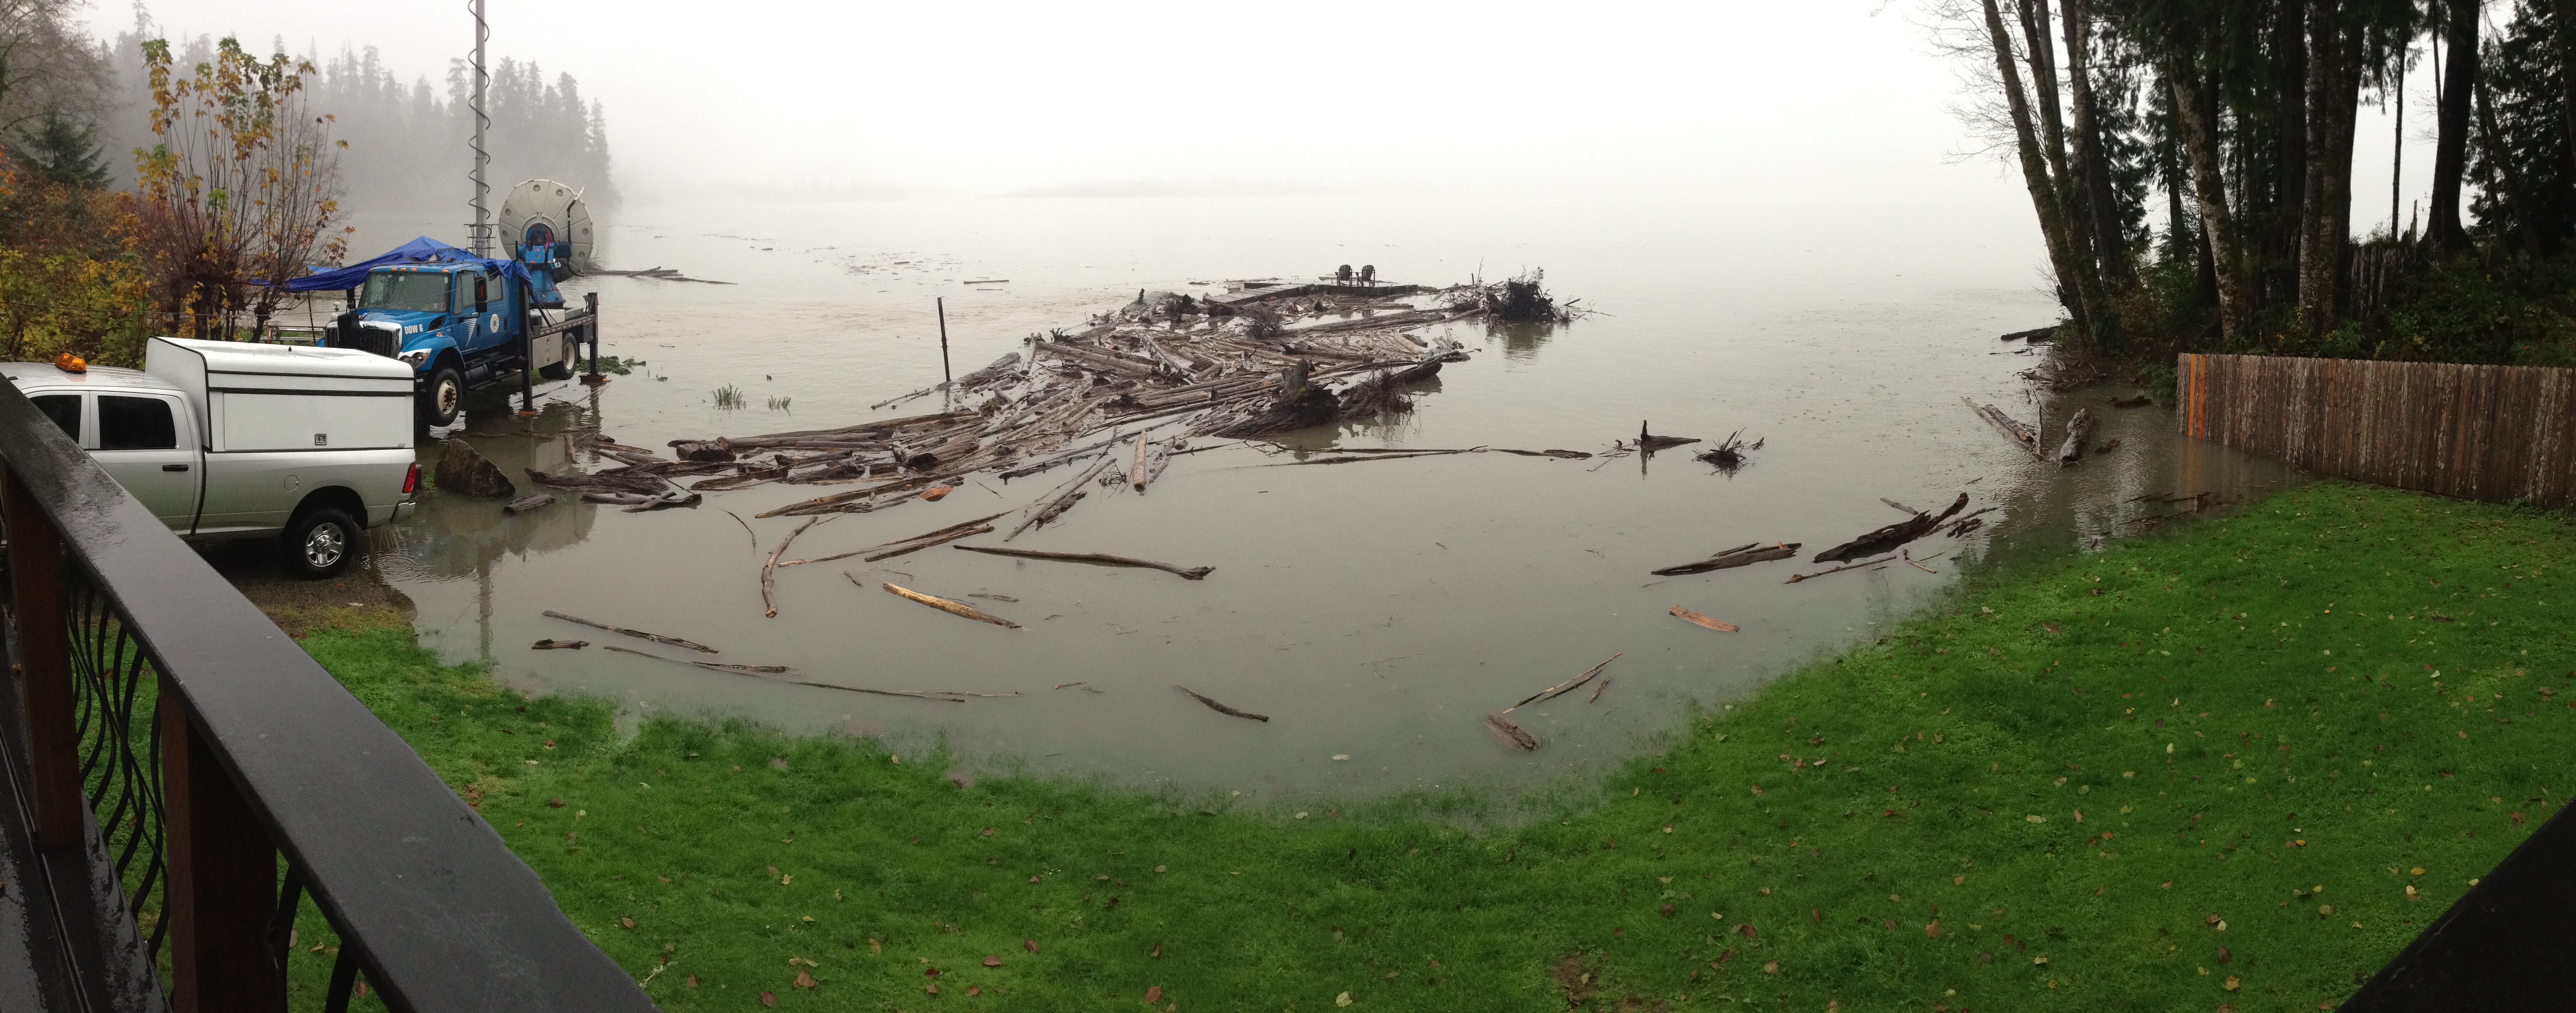
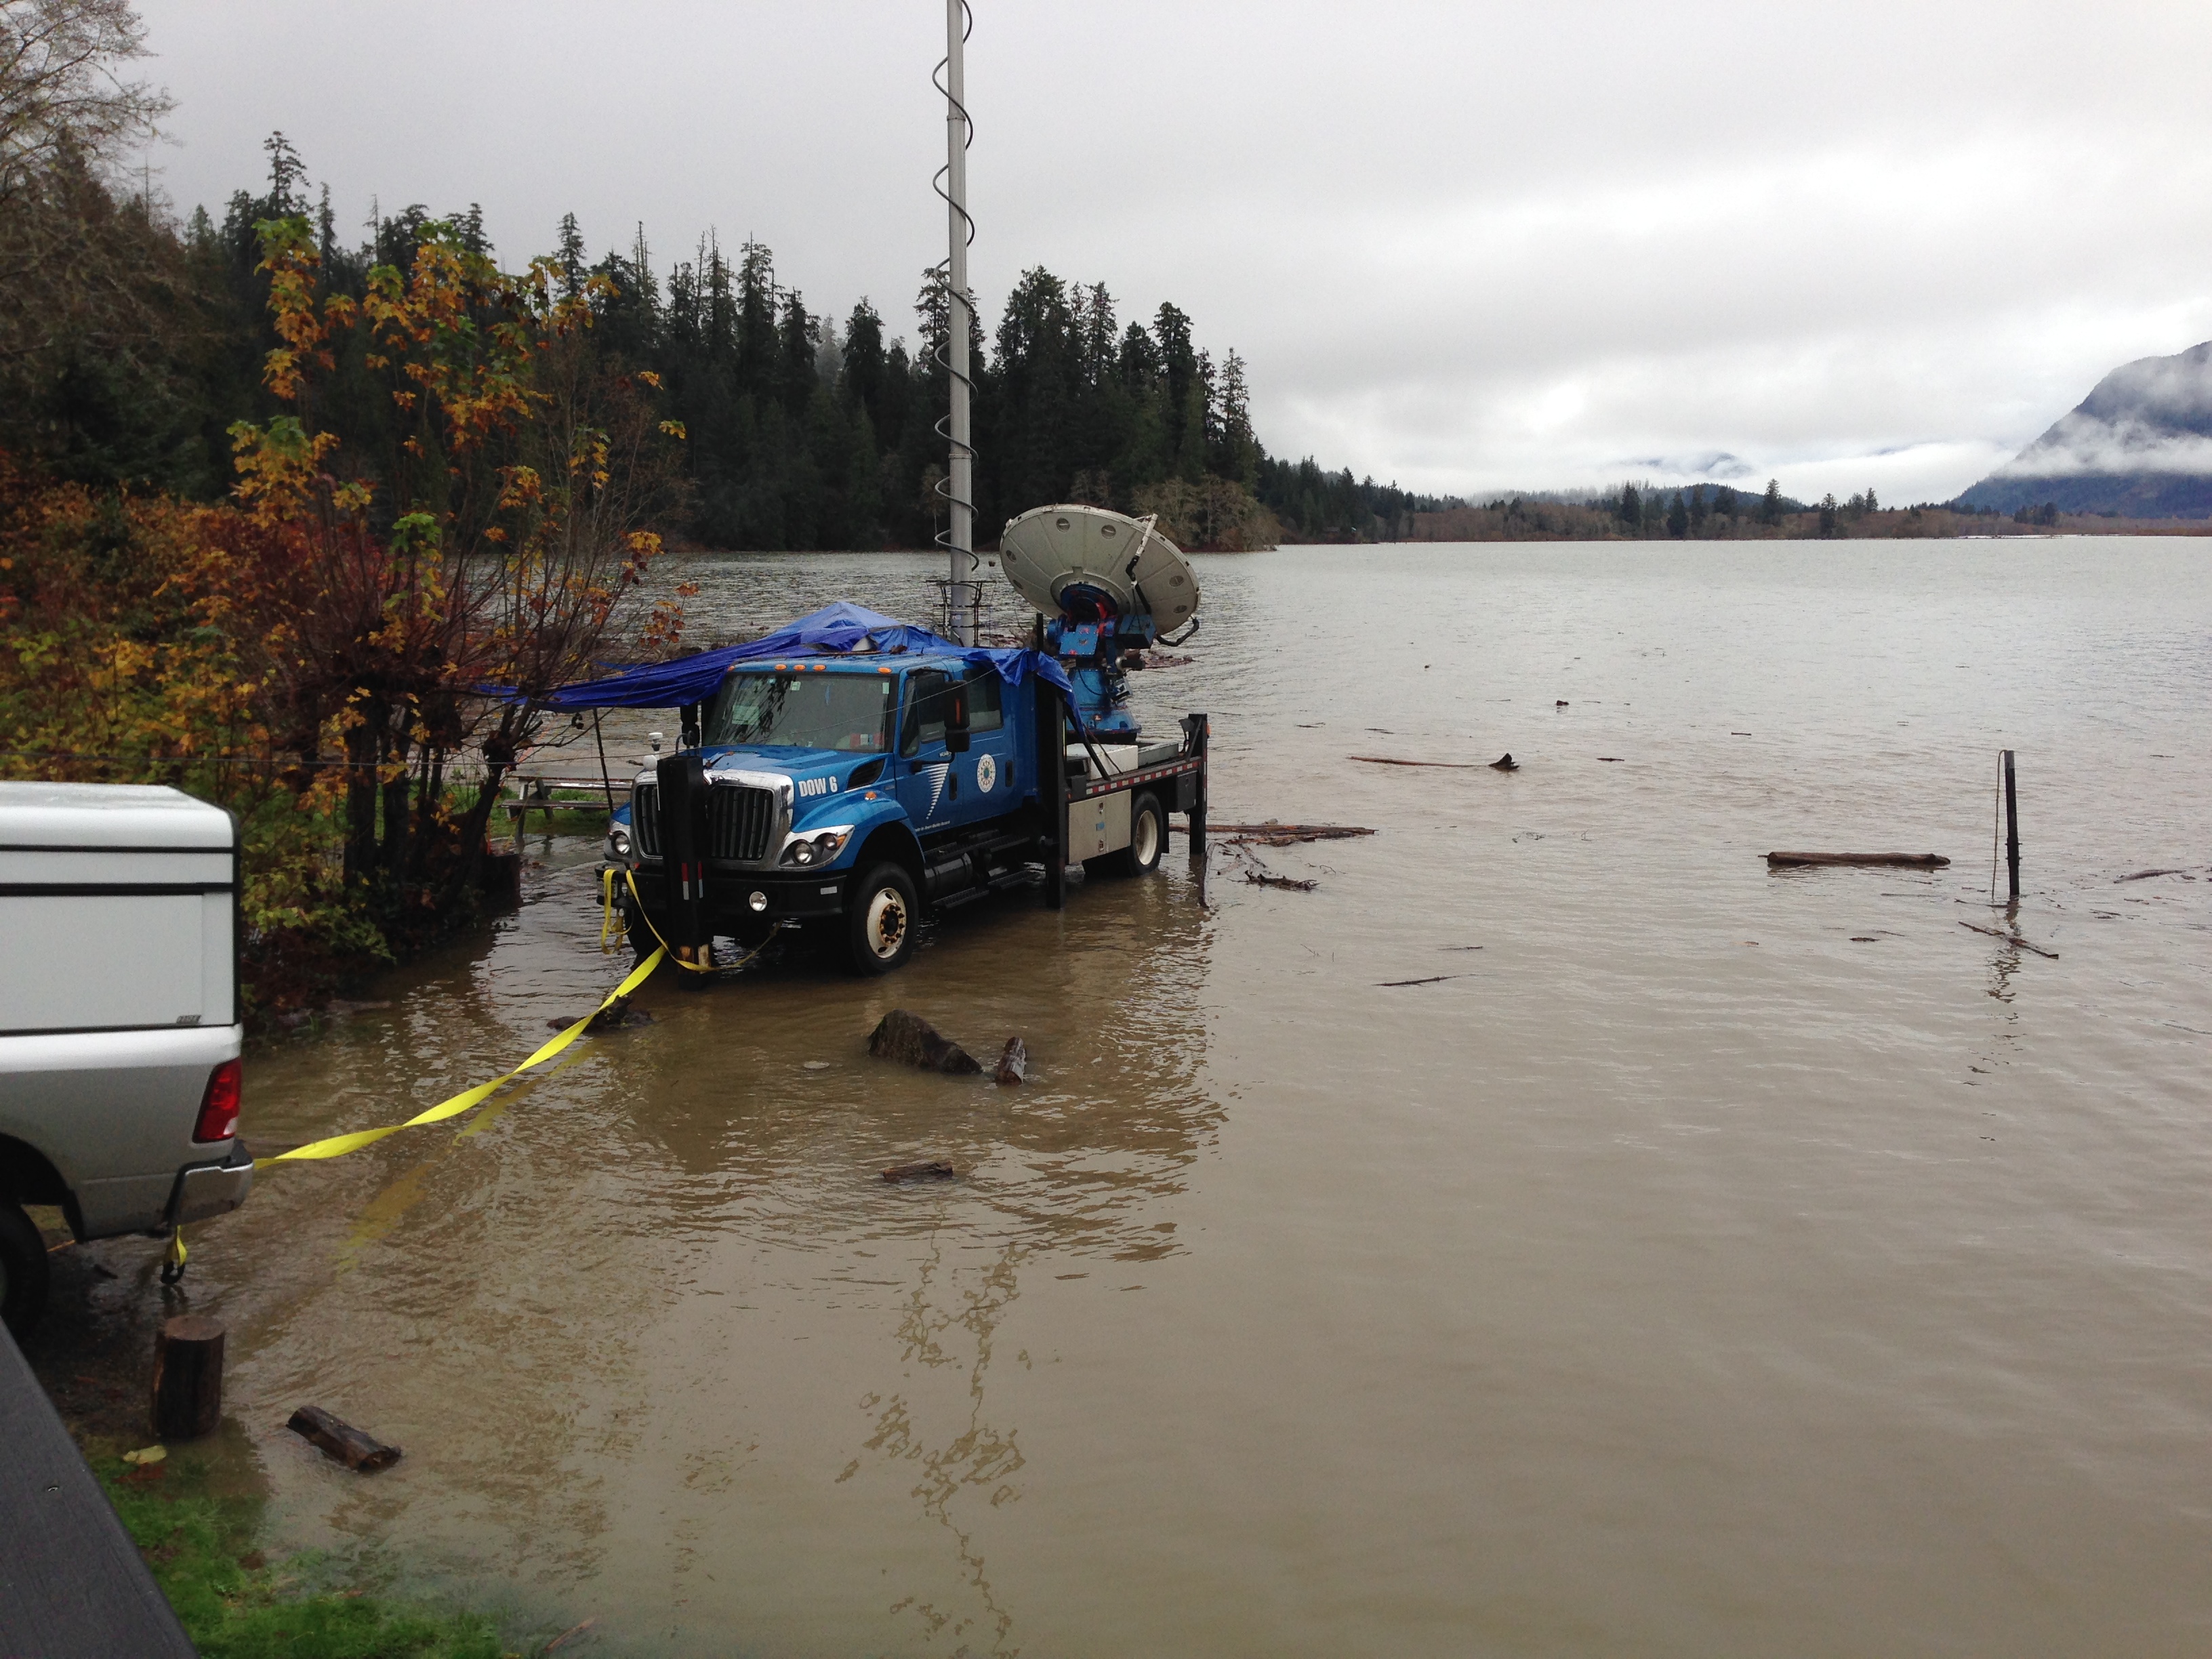
same region the previous 24 h. The runoff
nearly flooded the DOW radar (Figure 3), where
Lake Quinault was rising by about half a foot
every hour for several hours. At 500 hPa, the
OLYMPEX region lay on the south side of a jet
east of a trough, which was digging moving
slowly eastward (Figure 4).
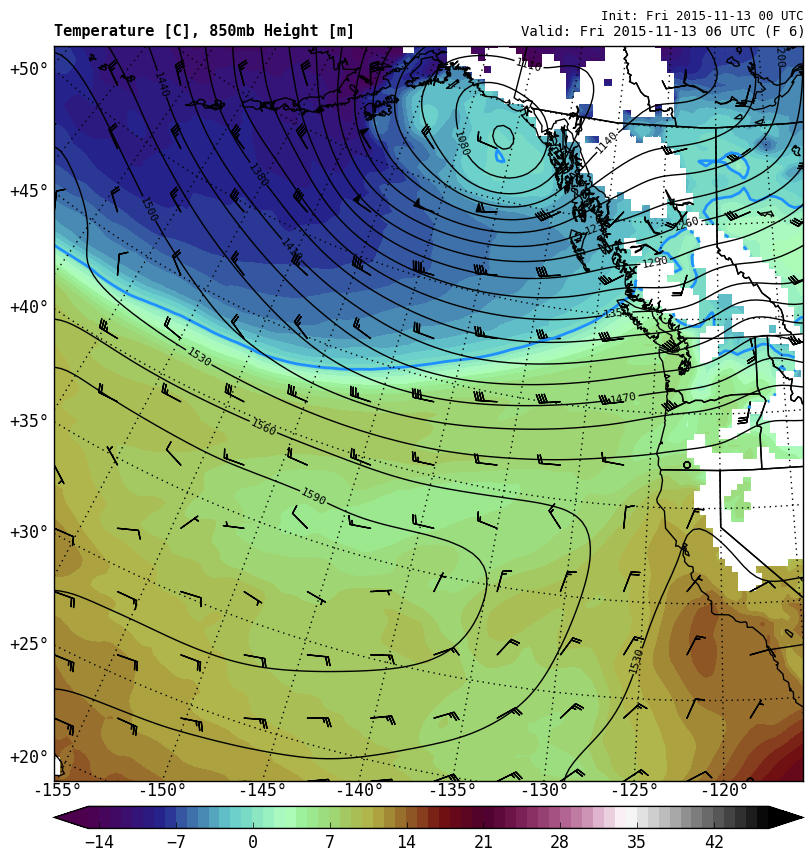
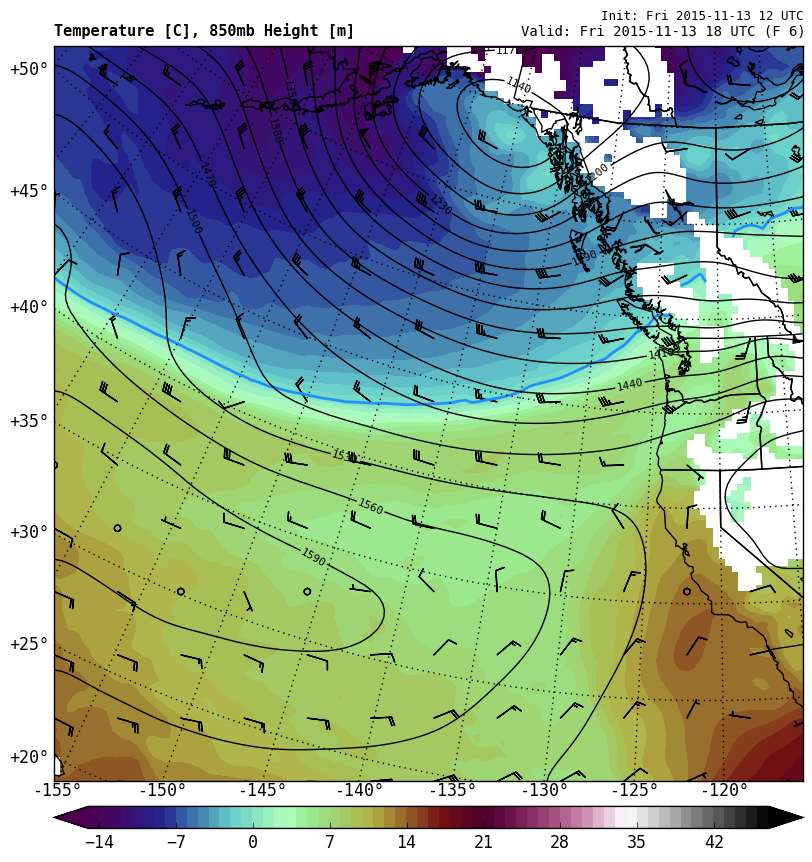
At 850 hPa, the wam flow continued stream
toward the Olympic Mountains (Figure
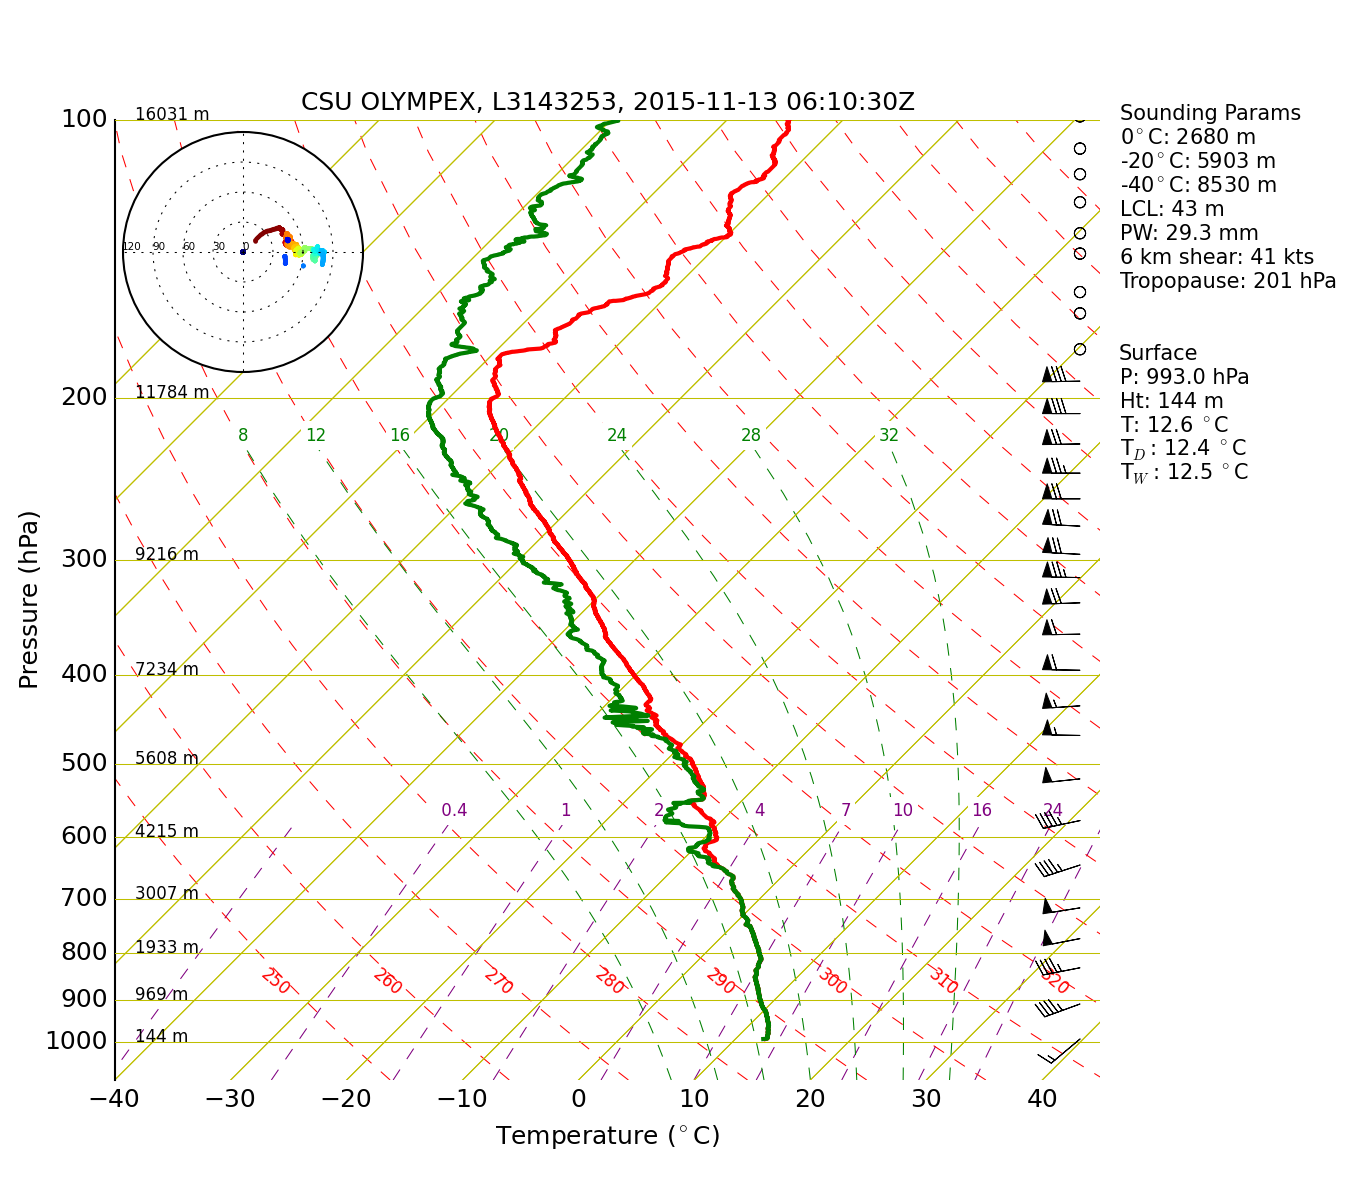
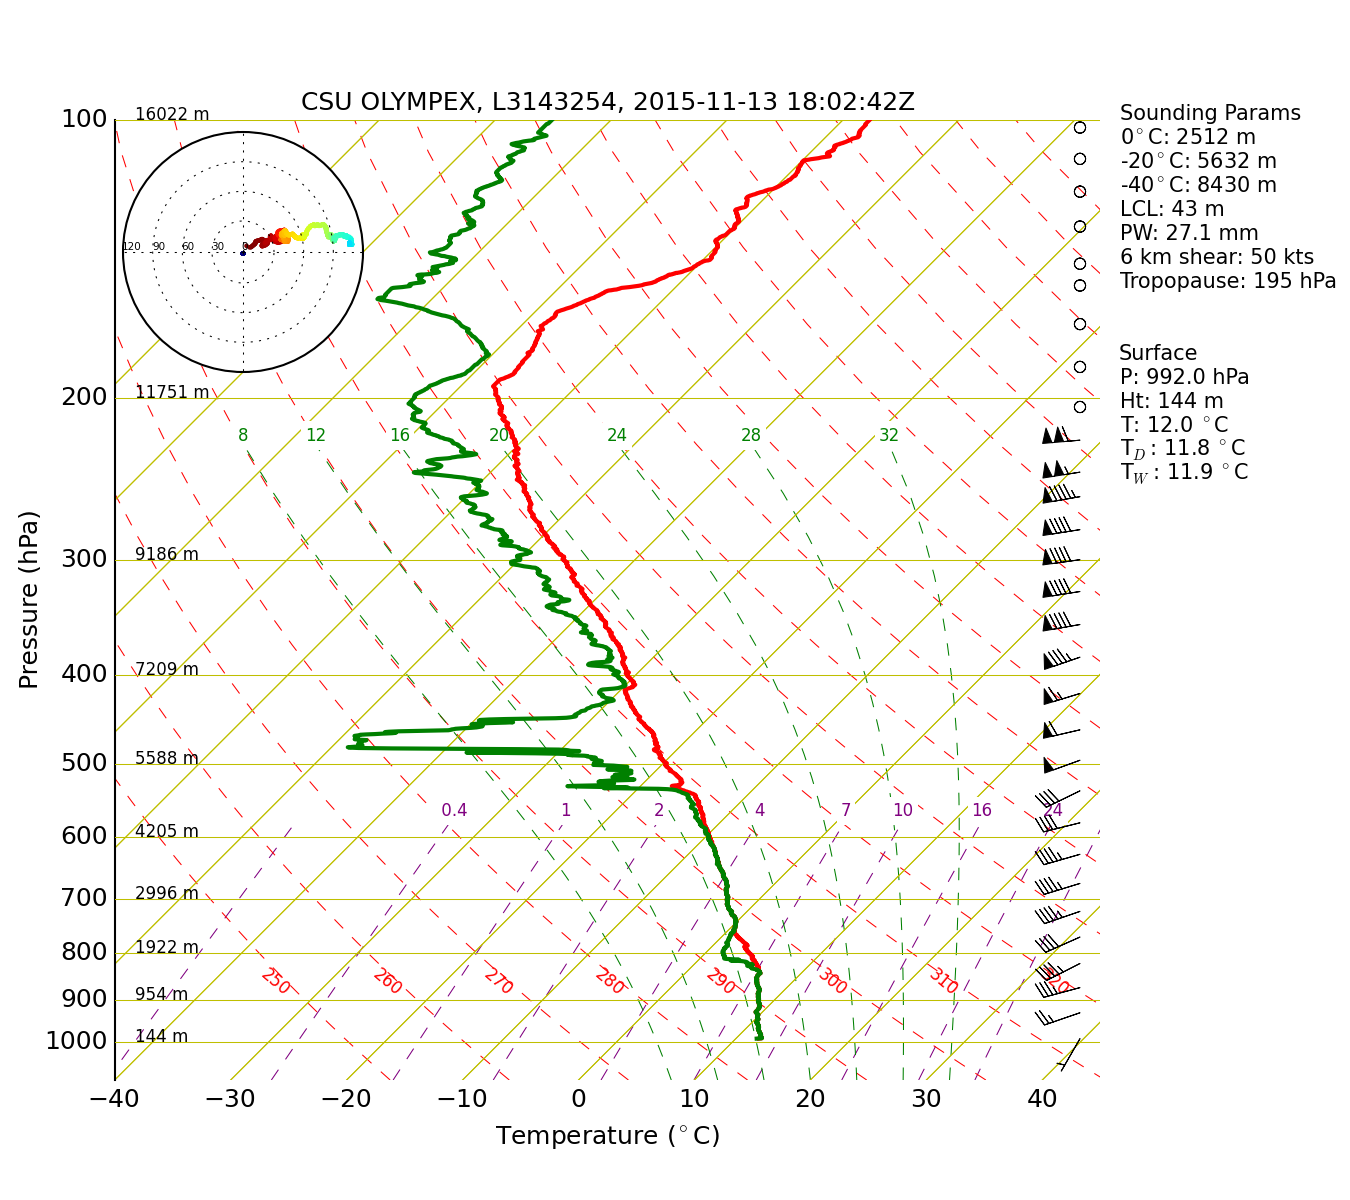
5). The soundings taken at NPOL
showed showed moisture up to 200 hPa, with an
occasional dry layer between cloud decks and
slight moist instability in the lower
troposphere (Figure 6).
The satellite imagery in Figure
7 shows that the OLYMPEX area lay under
the frontal cloud band for the whole period.
Note that by 2100 UTC wave development on the
front was manifesting. The Langley radar data
in the left panel of Figure
8 show the large prefrontal echo over
the Olympic Mountains and the narrow cold
frontal rainband far to the northeast. The
right panel shows the narrow cold frontal
rainband arriving over the OLYMPEX region at
about 1600 UTC. It had not yet reached NPOL
(cross in the center of Figure
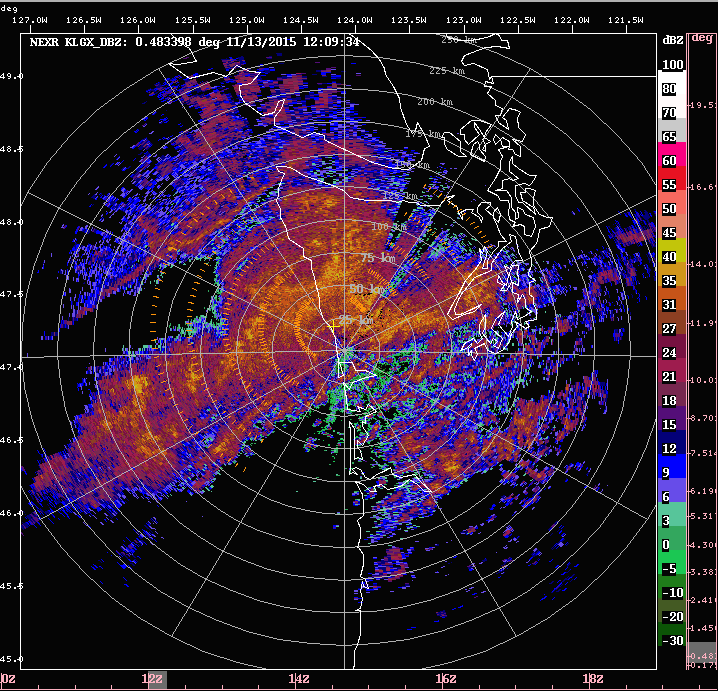
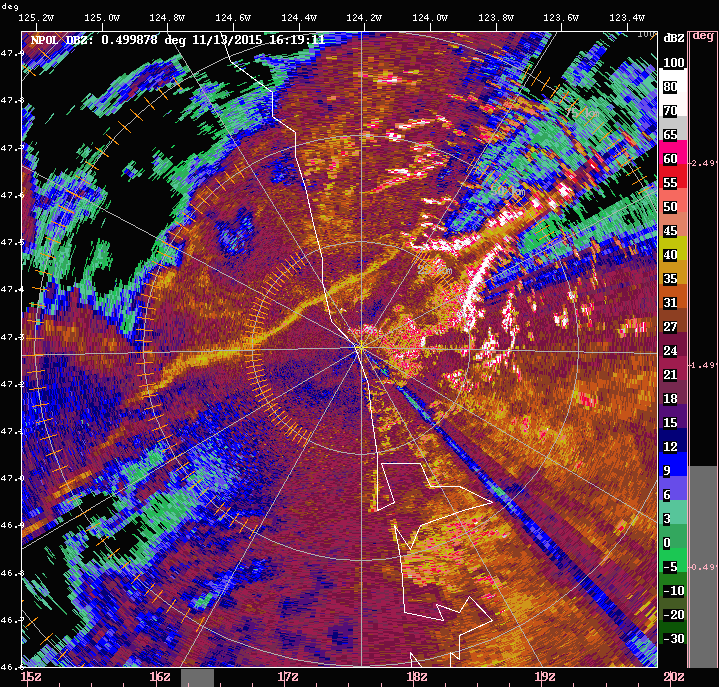
8). Figure 9
shows NPOL PPI displays of reflectivity and
radial velocity at 1619 UTC. The narrow cold
frontal rainband is the narrow line in the
reflectivity, and the wind shift at the line
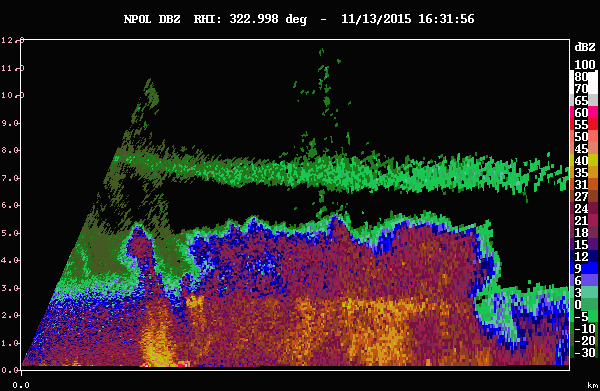
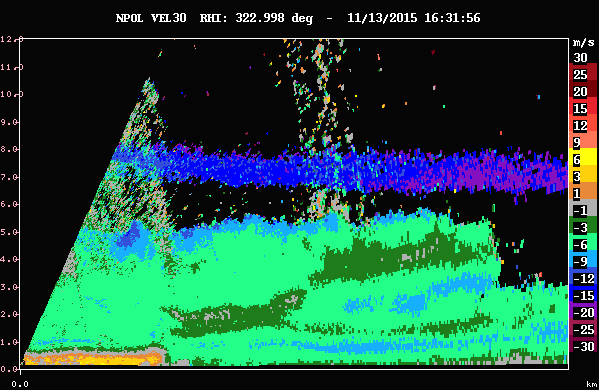
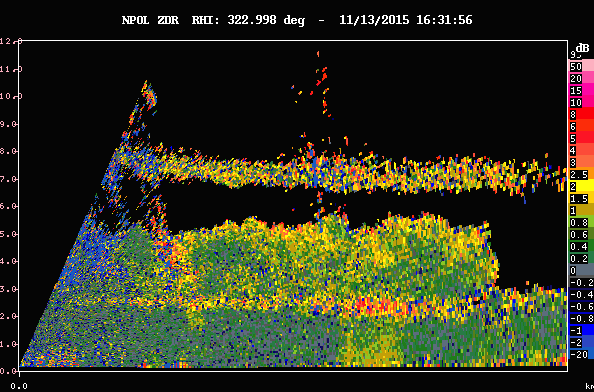
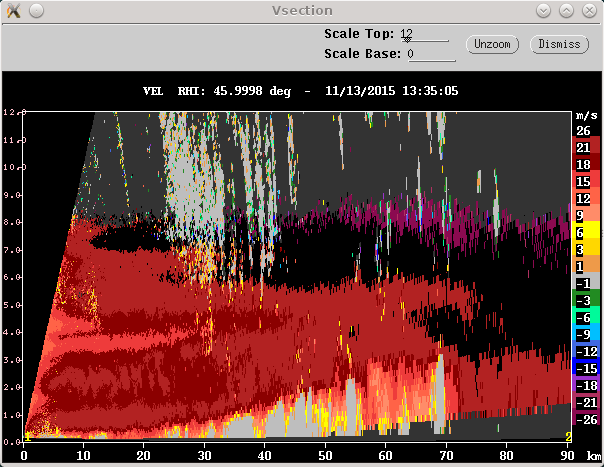
is evident in the radial velocity display. Figure 10 shows RHIs
across the cold frontal rainband. The
reflectivity maximum closest to the radar is
the front. The velocity cross section shows
the sharp frontal wind shift showed the
westerly component concentrated in the lowest
half kilometer with a bulbous nose, like a
density current. The vertical profile of ZDR
and particle identification signals look
similar in the cell at the frontal convergence
line to those elsewhere ahead of and behind
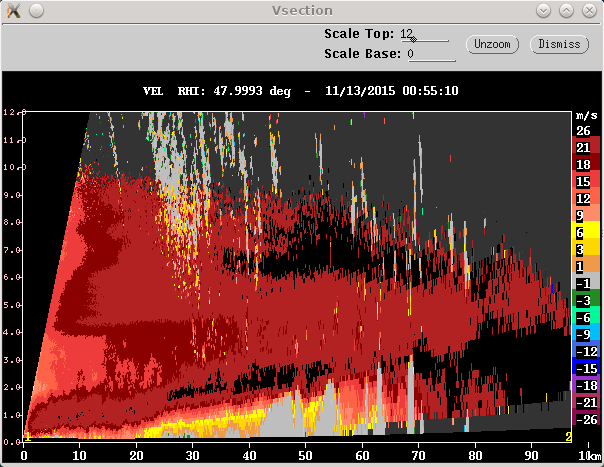
the line. Figure 11
shows how the low-level velocity maximum rises
over the terrain. This rise is a principal
factor in the orographic enhancement of the
precipitation over the mountains (accounting
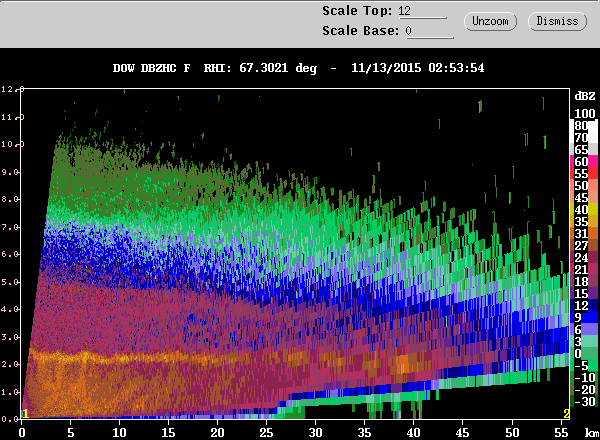
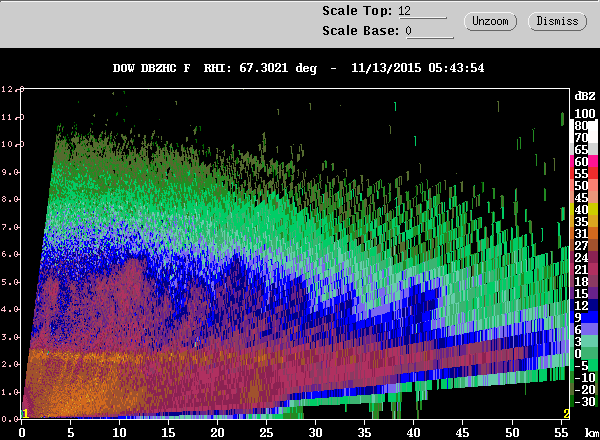
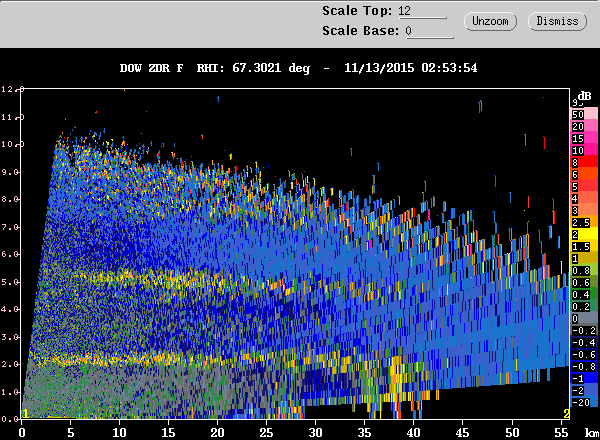
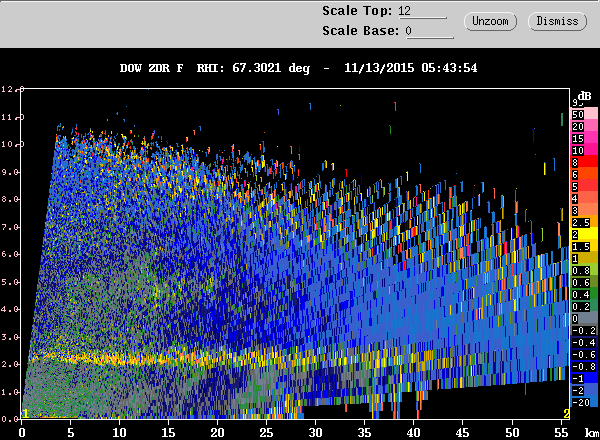
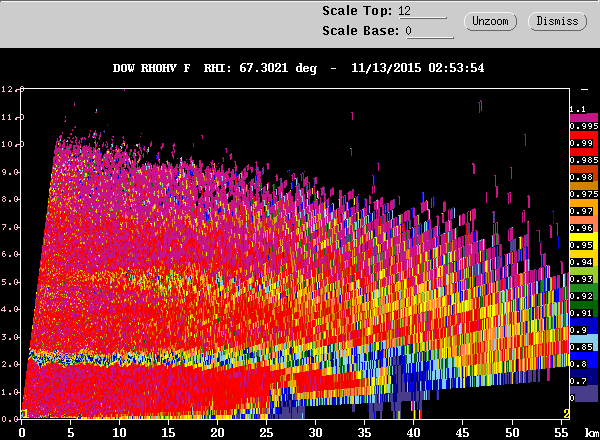
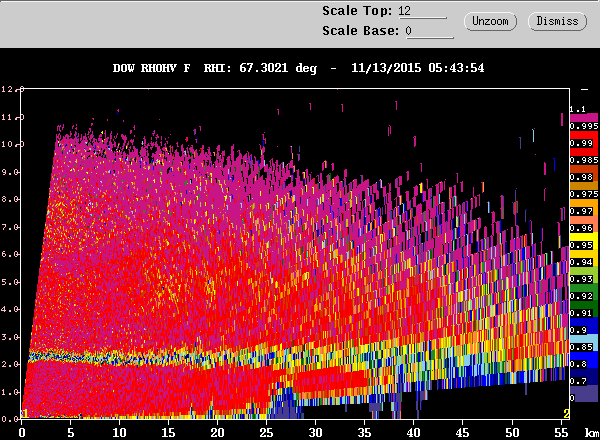
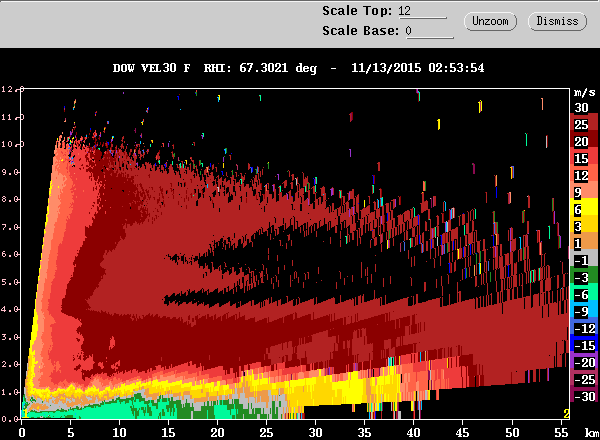
for the huge rain amounts seen in Figure 2). Figure 12 shows RHI
displays from the DOW radar during two times
(0253 and 0543 UTC) during the tie of enhanced
prefrontal precipitation. The echo was
basically stratiform but contained embedded
convection, as seen prominently in the later
example in Figure 12.
In the earlier example, the stratiform radar
echo showed clearly the persistent secondary
maximum 2-3 km above the melting level (i.e.
in the dendritic growth zone, where ice
particle aggregation occurs); it appears in
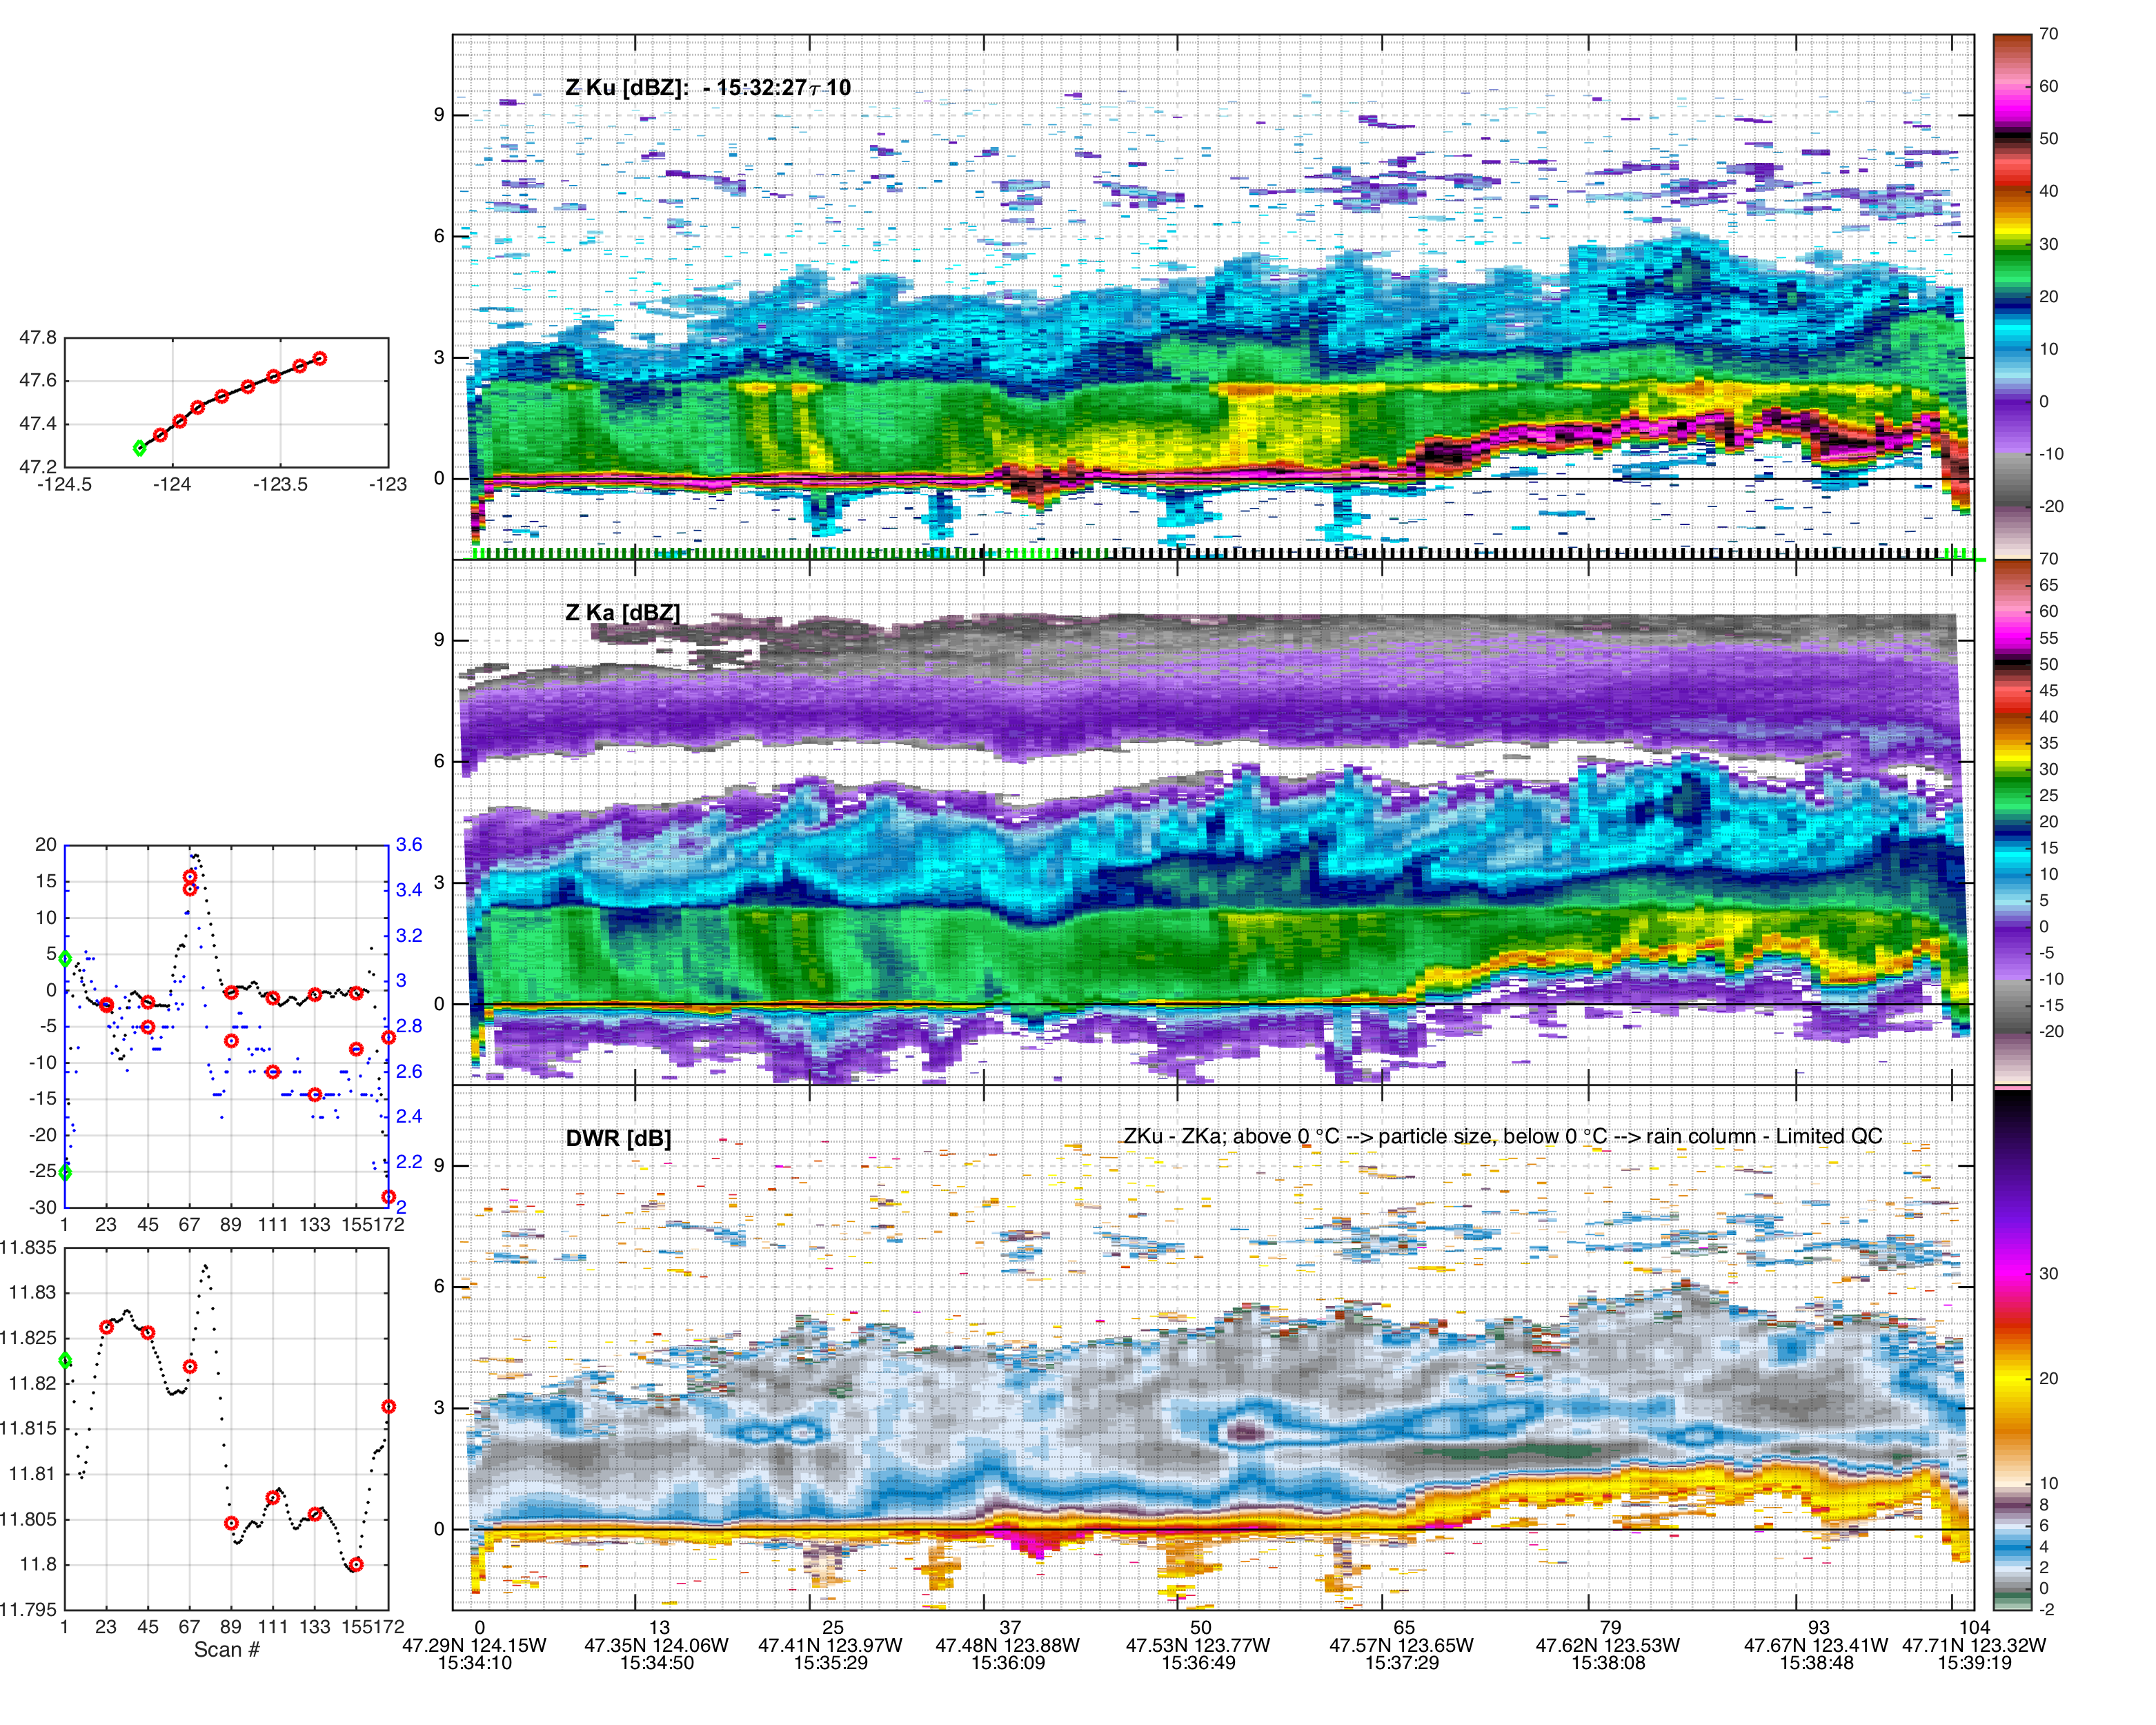
dBZ, ZDR, and rhohv. Figure 13
shows examples of the Ku and Ka band APR radar
data obtained on the DC8 flight shows the
extensive prefrontal stratiform precipitation.
The earlier section (left panel) shows the
high bright band in the prefrontal
precipitation over the mountains. The later
section (right panel) shows the rise of the
bright band from behind to ahead of the front.
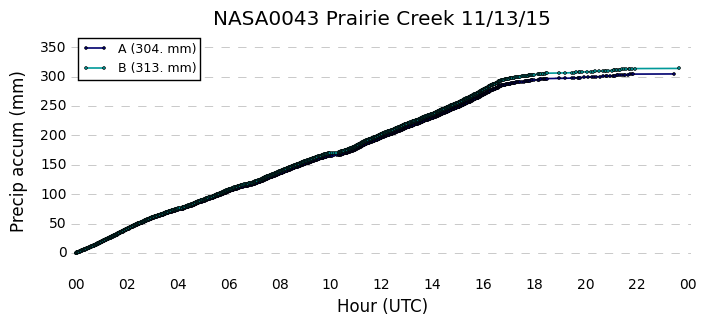
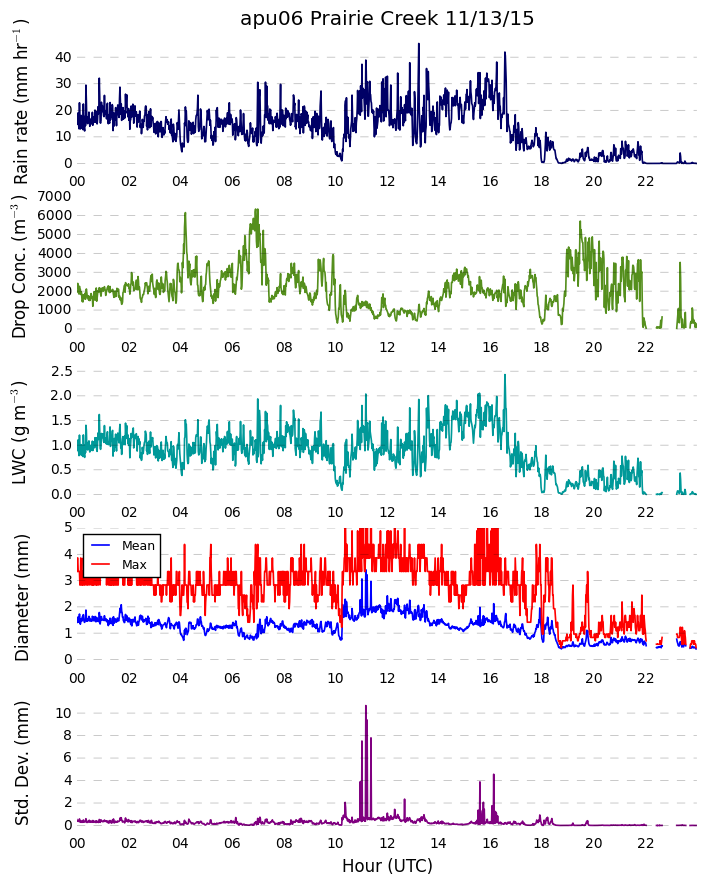
Detailed observations of the precipitation at
the Prairie Creek site in Figure
14 shows the accumulation of 300 mm by
the dual tipping bucket gauge (left panel).
Rain rates hovered around 15-20 mm/h
continuously for over 16 h as the moist flow
kept rising over the mountain ridge (middle
panel). The drop diameters tended to be small
but with some larger drops of 4-5 mm (right
panel). The MRR data in Figure
15 show that the fall speeds were mostly
~6 m/s, occasionally reaching 7-8 m/s.
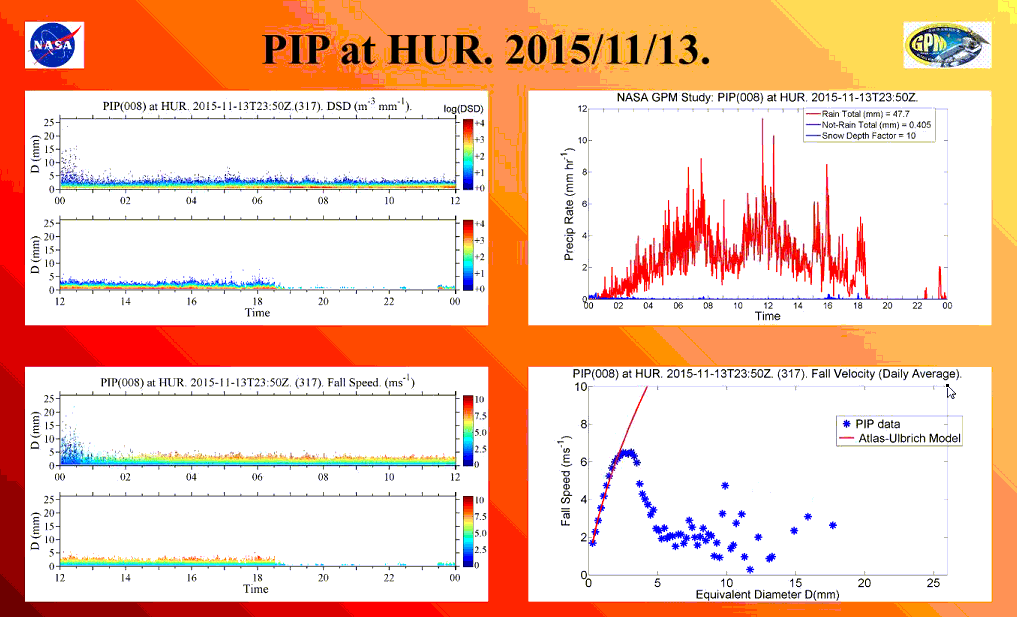
Hurricane ridge had smaller drops and lower
fall speeds (~2-3 m/s) and almost no snow (Figure
16). |
|
Figure 1.
Flight tracks of DC8 (cyan) and Citation (pink)
aircraft on 13 November 2015 superimposed on the Langley
radar echo at 1623 UTC.
|
|
Figure 2. 24-h precipitation
accumulation on 13
November 2015.
|
 |
 |
 |
|
Figure 3. DOW radar on, left
to right 3 , 13 and 14 November 2015.
|
 |
 |
|
Figure 4. Geopotential
height, temperature, and wind at the 500 hPa level
at 0600 UTC and 1800 UTC 13
November 2015
|
 |
 |
|
Figure 5. 850 hPa geopotential
height, temperature, and winds at 0600 and 1800 UTC 13 November 2015.
|
 |
 |
|
Figure 6. Soundings
at NPOL,
0600
and 1800 UTC 13 November
2015
|
 |
 |
 |
 |
| Figure
7. Infrared
satellite imagery for 13 November 2015. Left to
right: top 0300 and 0900 UTC, bottom 1500 and 2100
UTC. |
 |
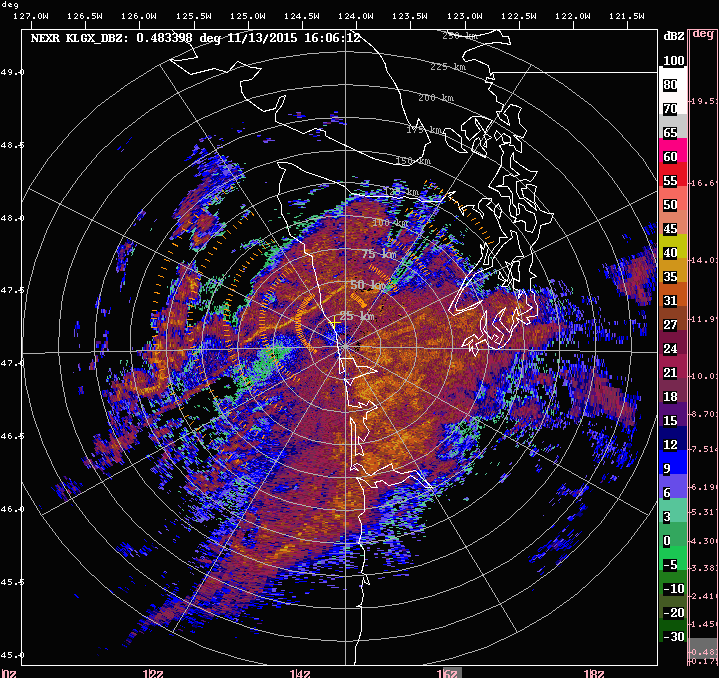 |
| Figure
8.
Langley
radar imagery for 1200 and 1600 UTC 13
November 2015 UTC. |
 |
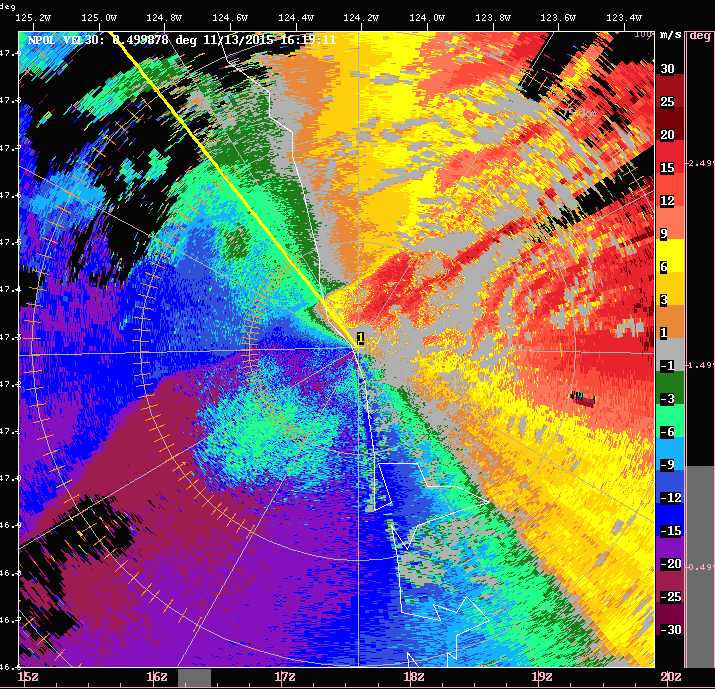 |
| Figure
9.
NPOL
reflectivity (left) and radial velocity (right) at
1619 UTC 13 November 2015. |
 |
 |
 |
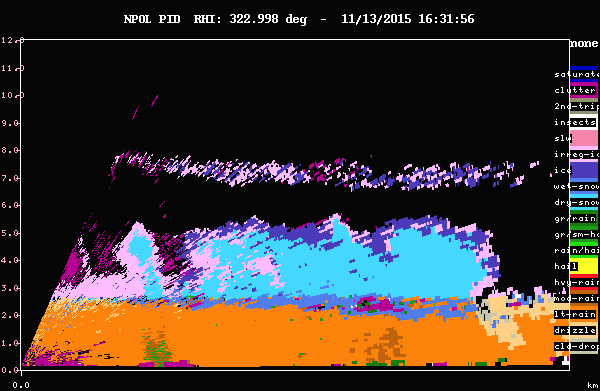 |
| Figure
10.
RHIs of dual polarimetric
variables seen by the NPOL
radar at 1631
UTC 13 November 2015. |
 |
 |
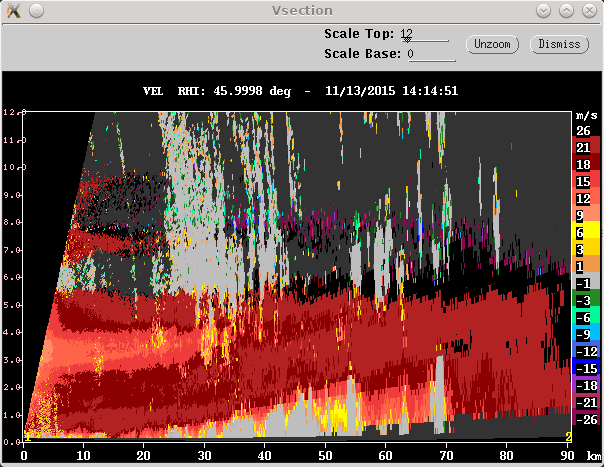 |
| Figure
11.
NPOL radial
velocity cross sections pointing northeast at 0055,
1335, and 1414 UTC 13
November 2015. Streaks of side lobe echoes associated with the
rough terrain obscure the velocity patterns. |
 |
 |
 |
 |
 |
 |
 |
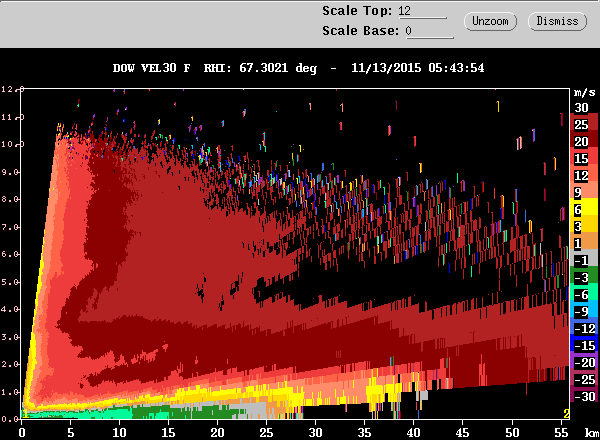 |
| Figure
12.
DOW radar
RHIs pointing up
the Quinault Valley at 0253
and 0543 UTC 13 November
2015. |
 |
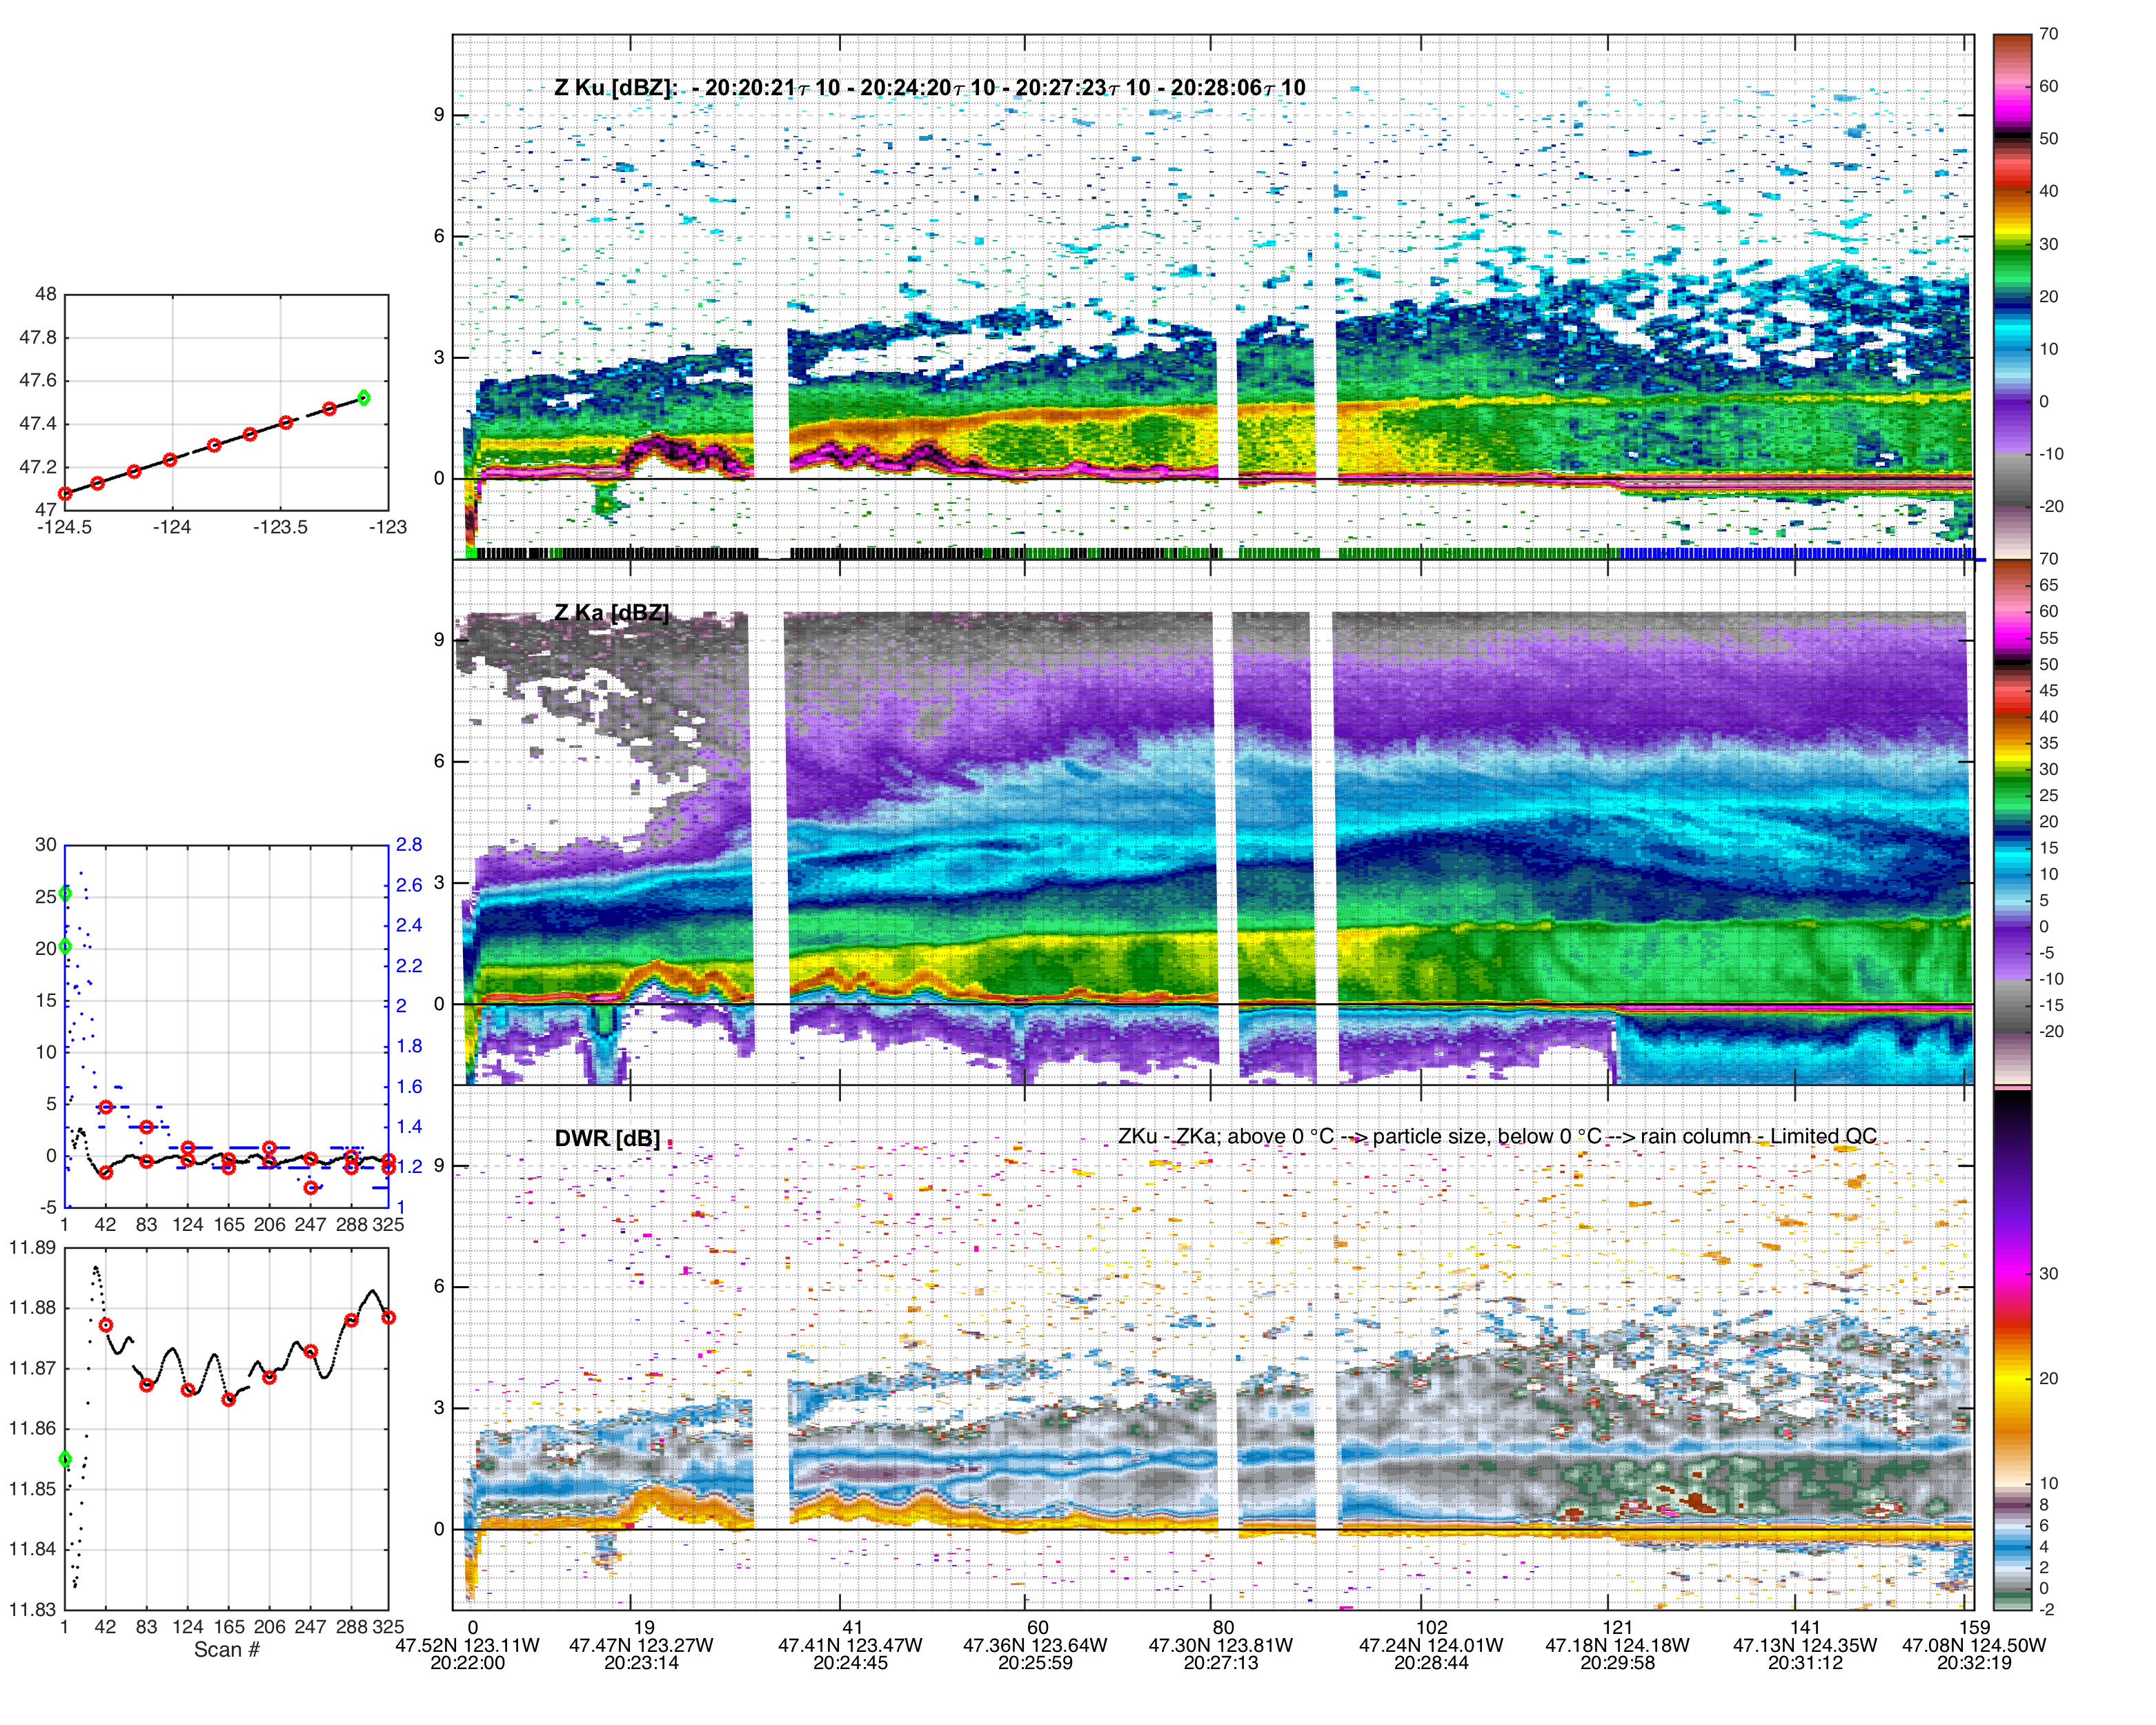 |
| Figure
13. Reflectivity from APR2 radar frequencies Ka
and Ku on DC8 on 13 December 2015 (top two panels).
Left: Crossing NPOL east to west. Right: Crossing NPOL
west to east. |
 |
 |
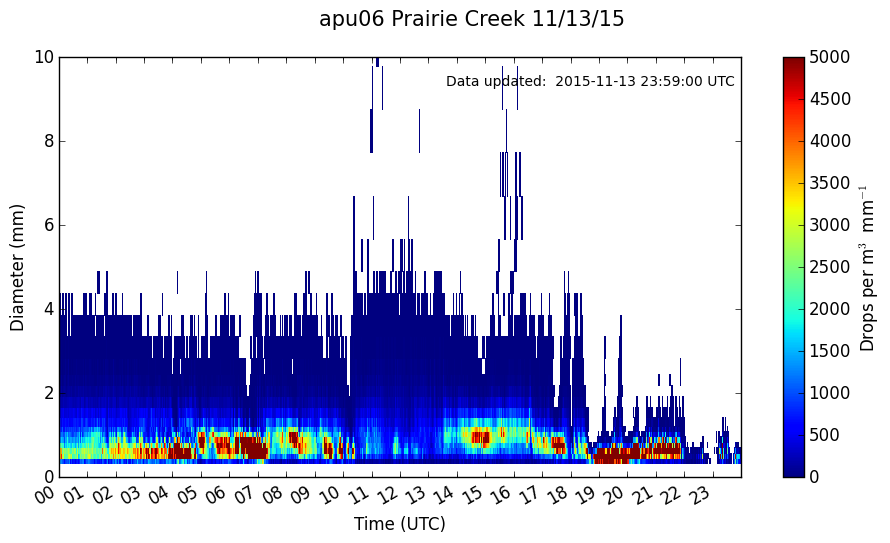 |
| Figure
14.
Detailed precipitation
data collected at the Prairie
Creek site 13 November 2015. |
| Figure
15.
MRR data from
Bishop/CRN site for13
November 2015. Data interrupted by power outage |
| Figure
16.
Detailed
data from Hurricane Ridge site, 13
November 2015. |