This day is notable as an
sample of a large stratiform rain area produced by baroclinic
processes and being modified by its passage over the
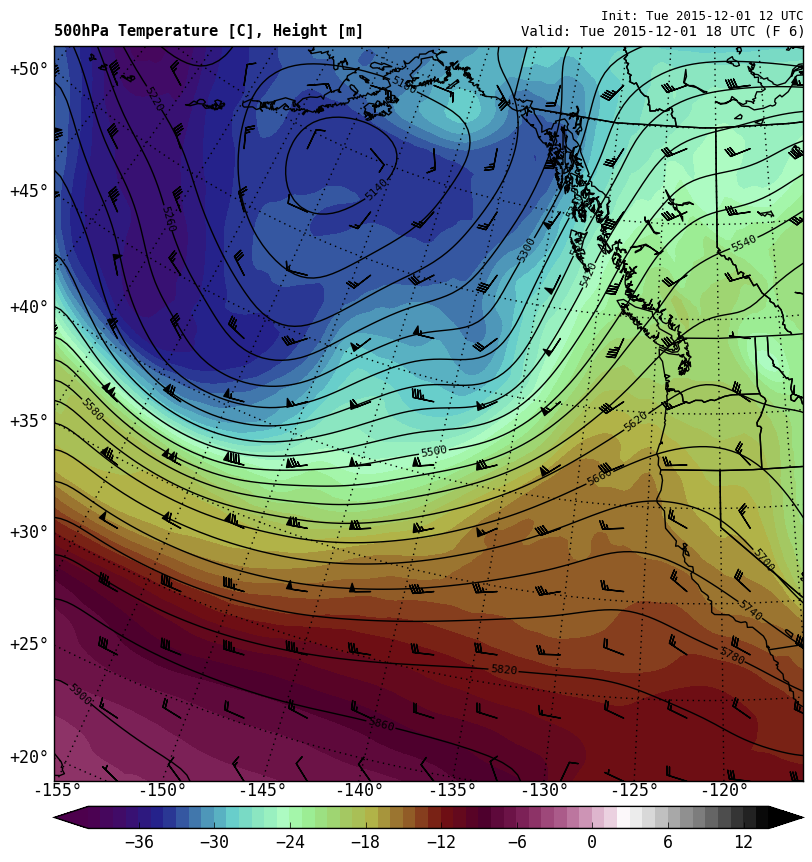
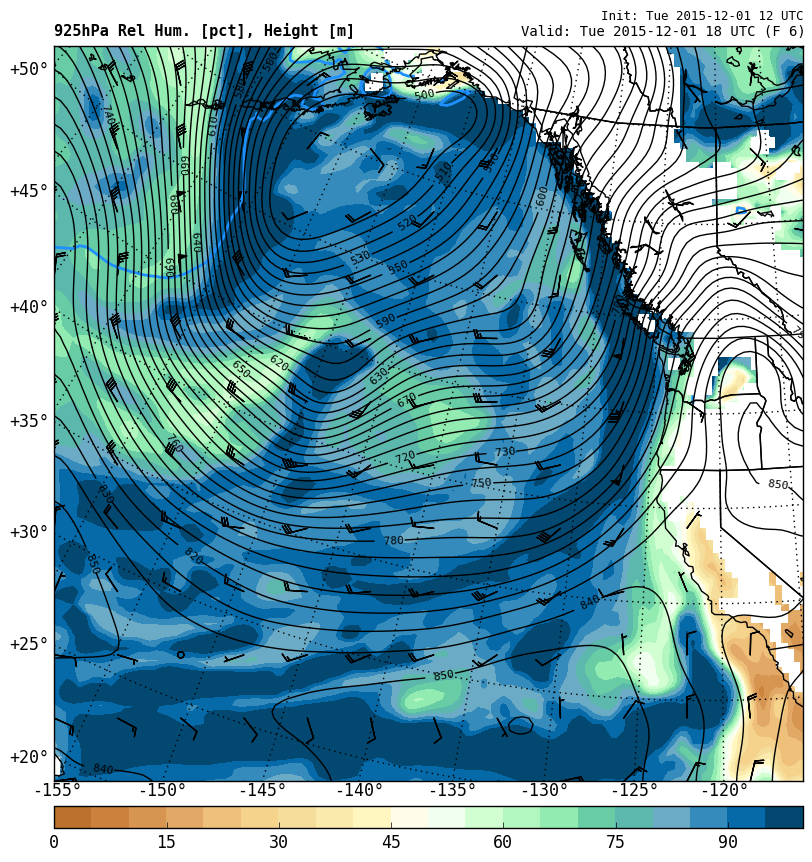
terrain of the Olympic Mountains. As seen in the 500 hPa map in
Figure 1, a weak shortwave trough was approaching the
Washington coast. The height contours were becoming
farther apart over Washington, so that its associated
frontal precipitation was weakening. However the moist
south-southwesterly flow seen at 925 hPa in Figure 1 was strong and flowing
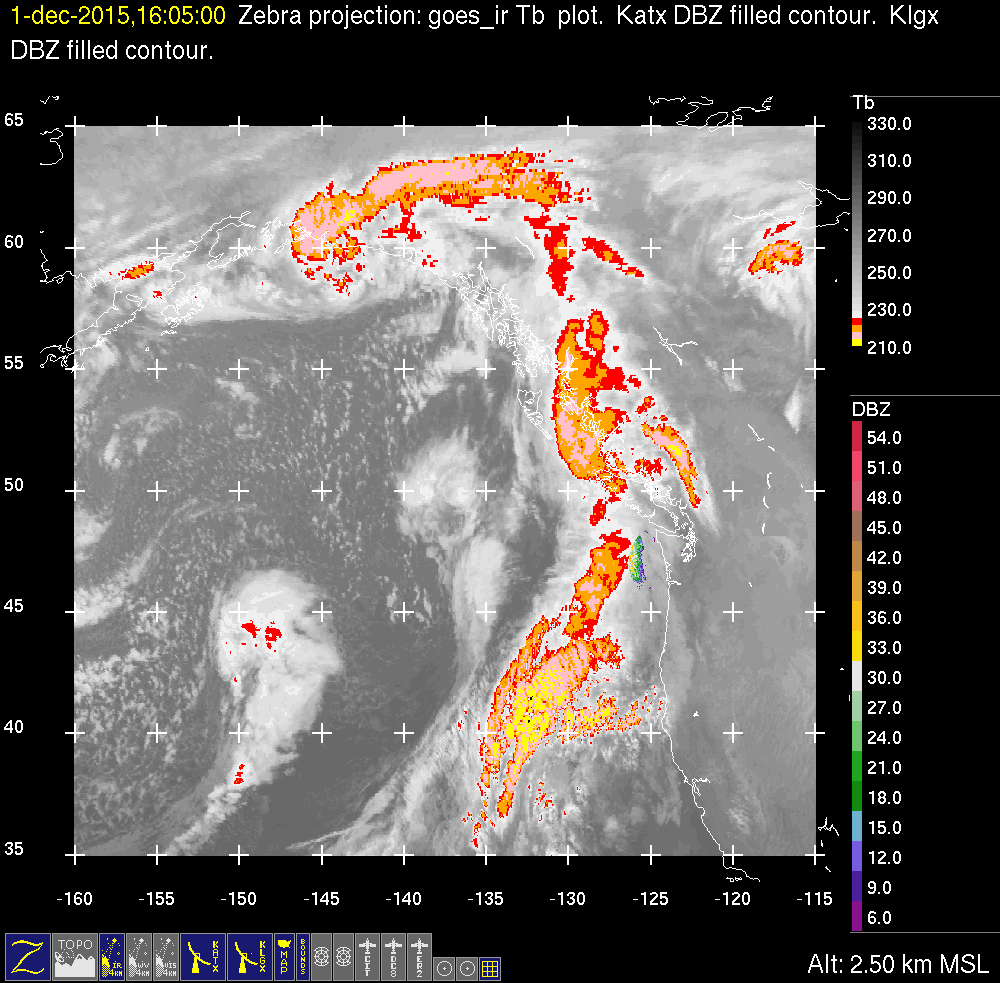
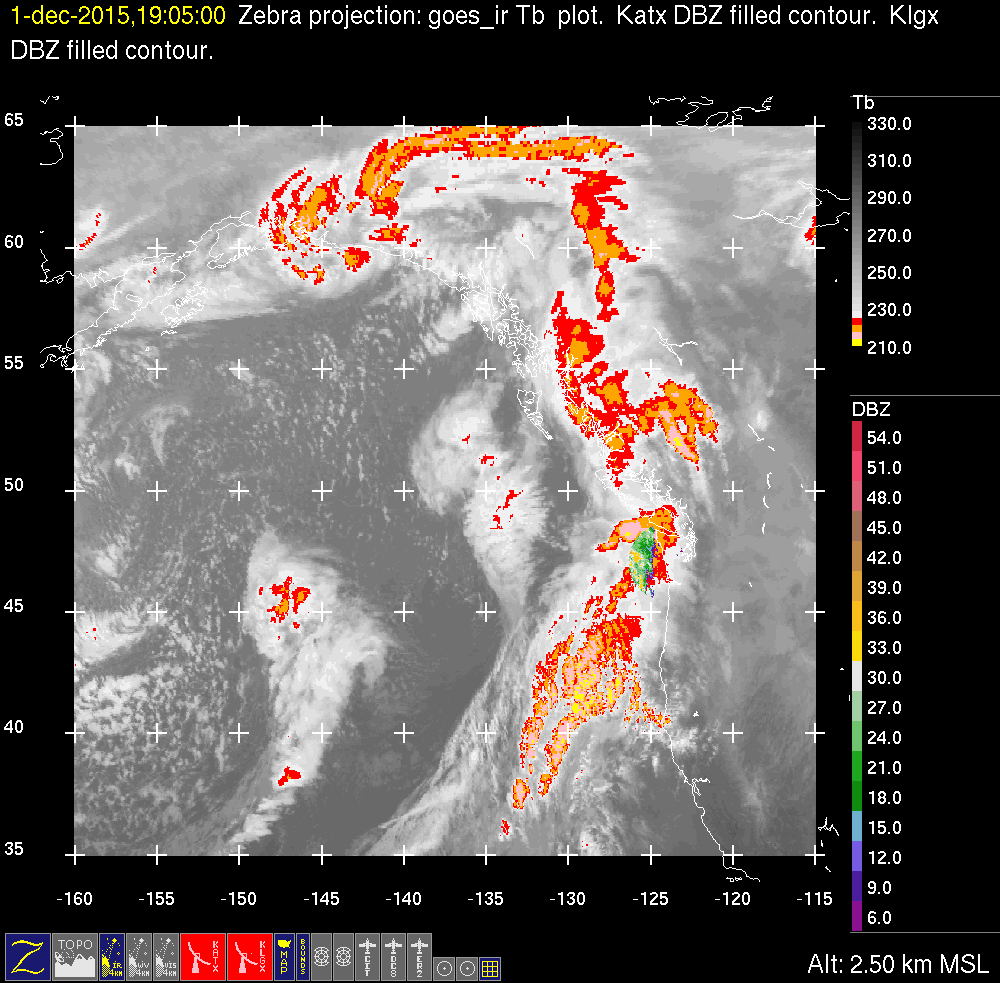
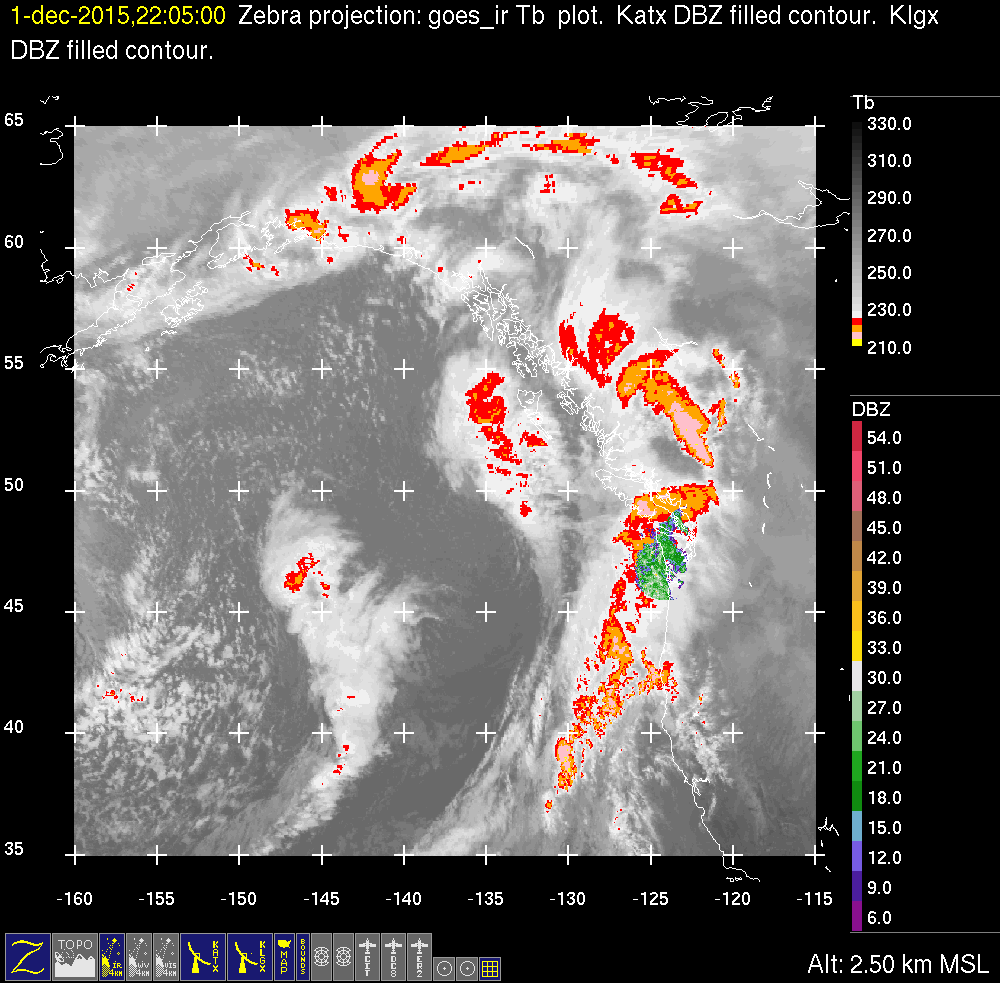
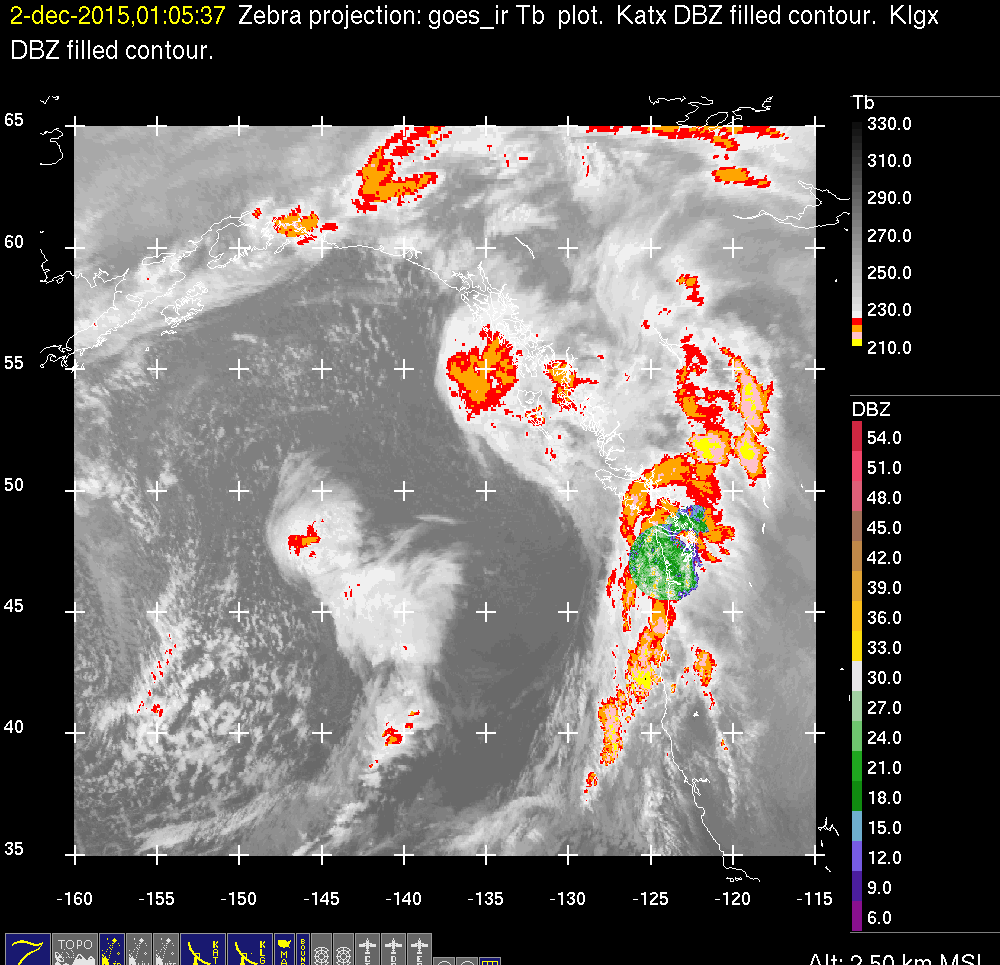
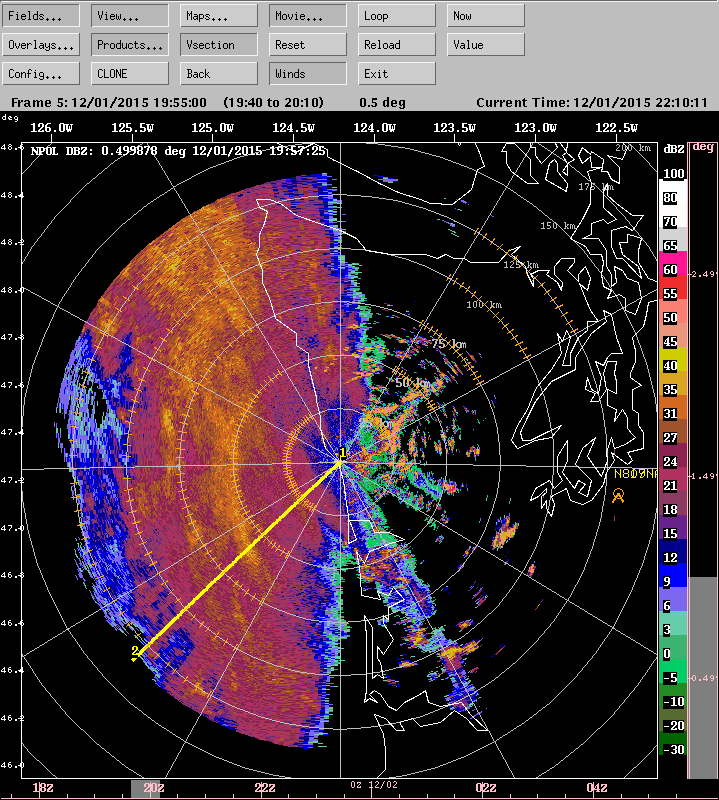
directly over the Olympic Range. The high clouds moving
over the OLYMPEX radars (Figure 2)
presented a somewhat ragged appearance, suggesting a
less than strong frontal system. The precipitation at
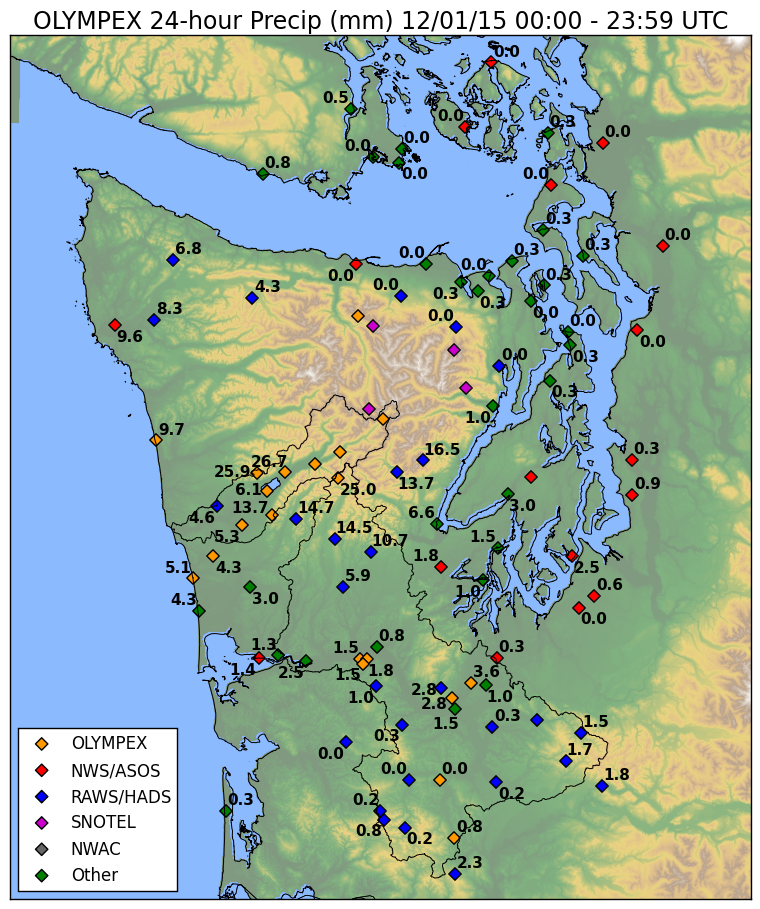
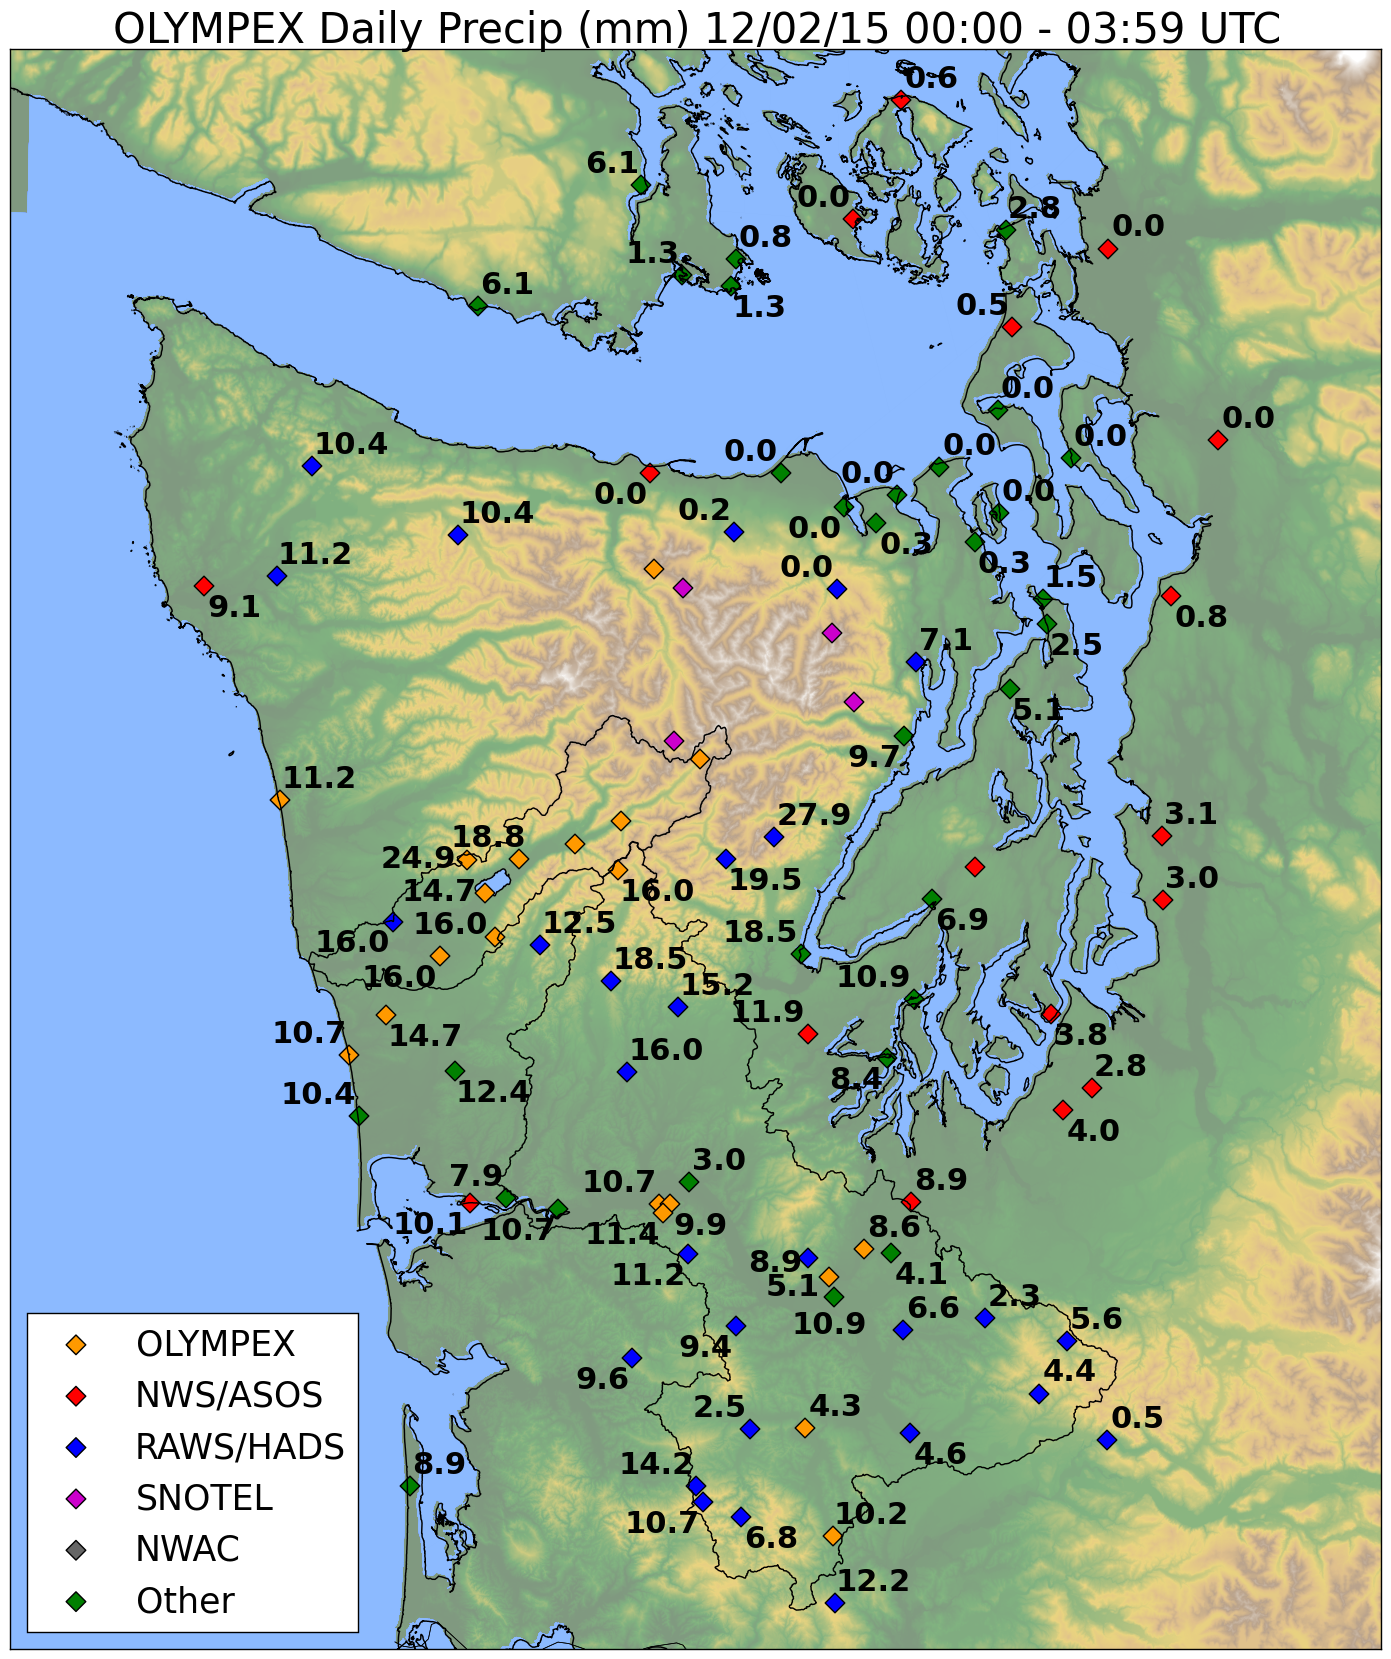
the surface fell partly on 1 December and partly on 2
December (Figure 3). The rain
was nearly evenly divided between the two 24 h periods.
The highest amounts were in the Quinault region. The
highest values summed over the two days were ~50 mm. The
OLYMPEX surface instrumentation in the Quinault region
indicated that values at lower altitude sites were ~30
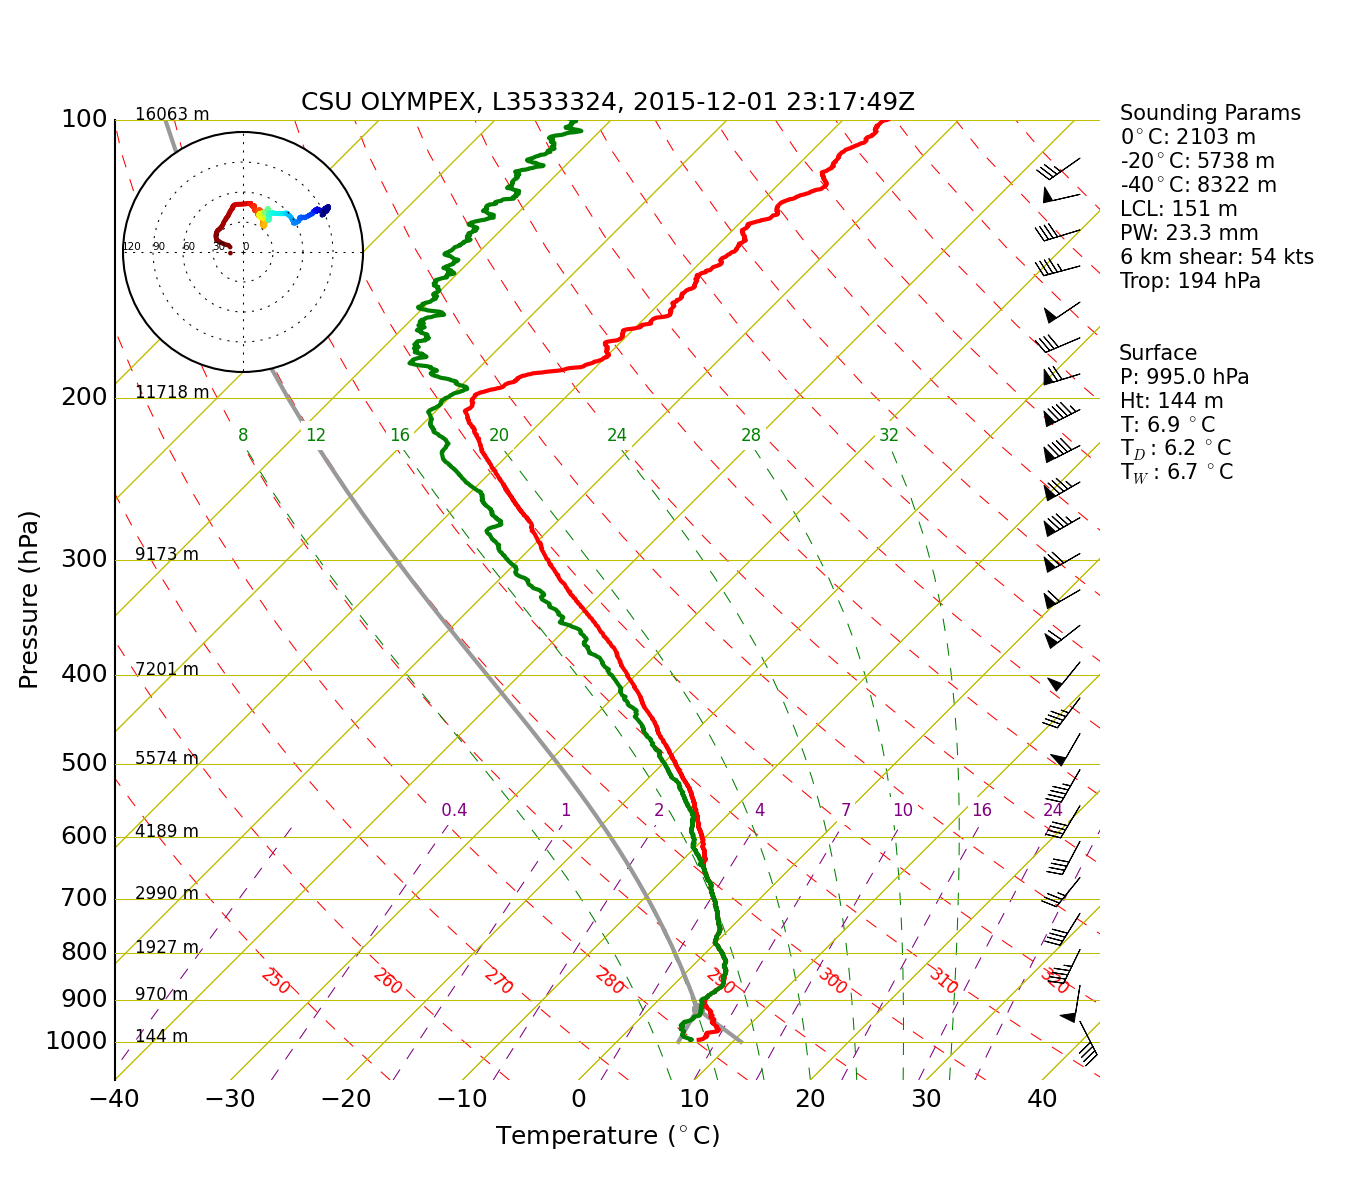
mm, consistent with orographic enhancement. A rawinsonde
sounding at the NPOL site at 2317 UTC on 1 December
(left panel of Figure 4)
showed a frontal structure with warm advection (veering
wind), a stable layer and saturated conditions. A
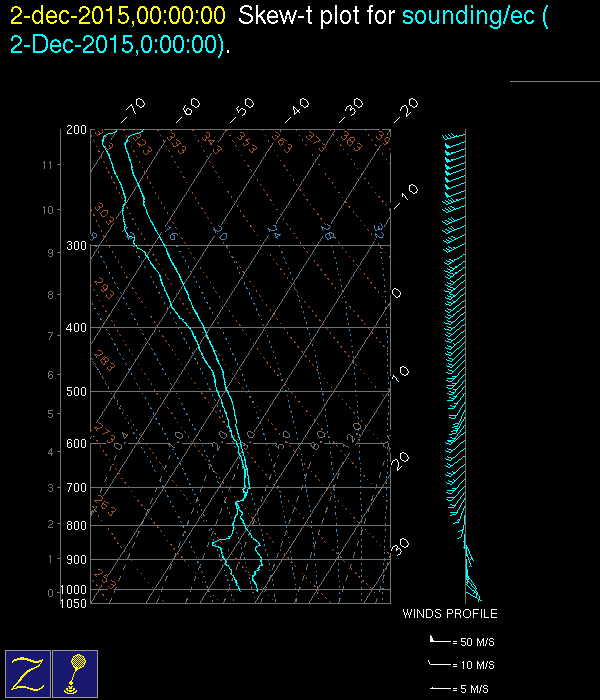
sounding at about the same time at the Environment
Canada site in Victoria (right panel of Figure 4) showed a drying
signature downwind of the Olympic Range; the sounding
exhibits a classic "Zipser Onion Sounding" shape with
subsidence induced drying below the precipitating
stratiform cloud. The classic sounding is associated
with trailing stratiform regions of squall lines;
however, this one is associated with the leeside
subsidence that prevented much rain (i.e. produced the
"rain shadow") on the northeast side of the Olympic
Mountains (Figure 3).
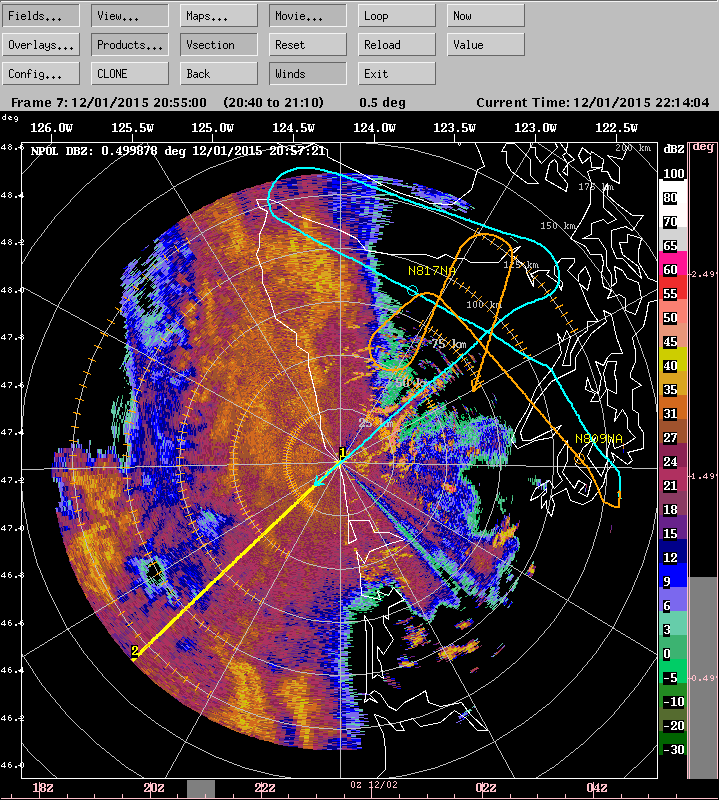
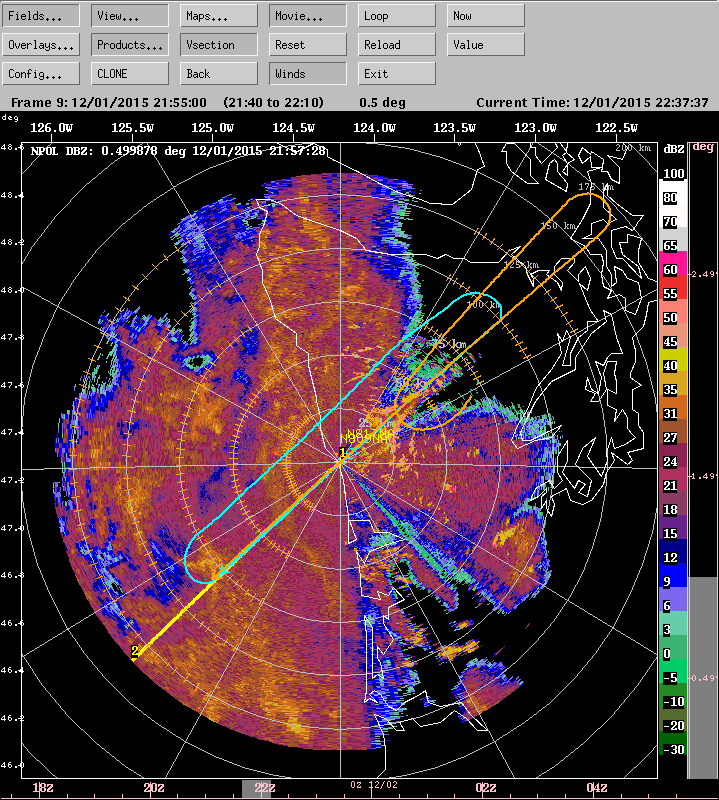
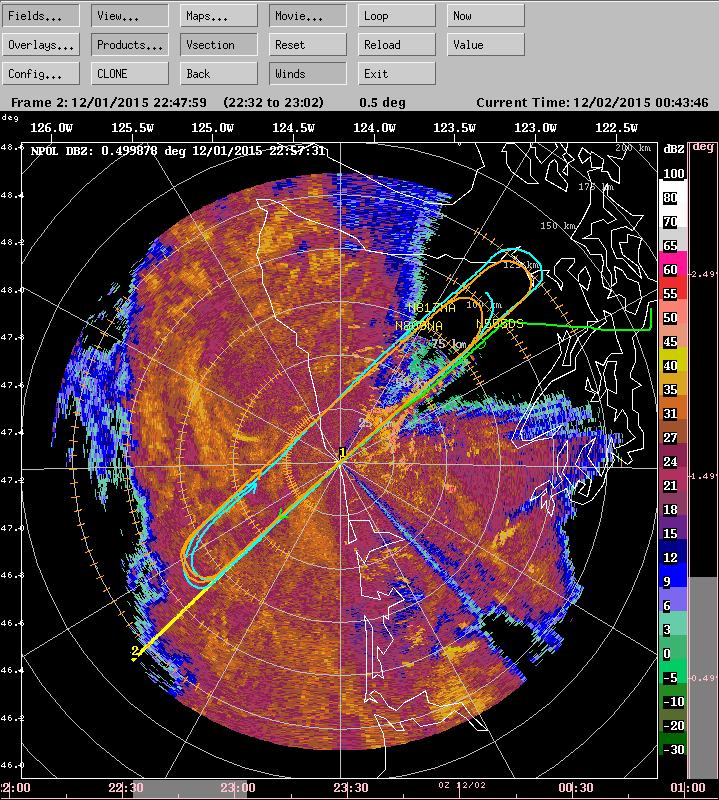
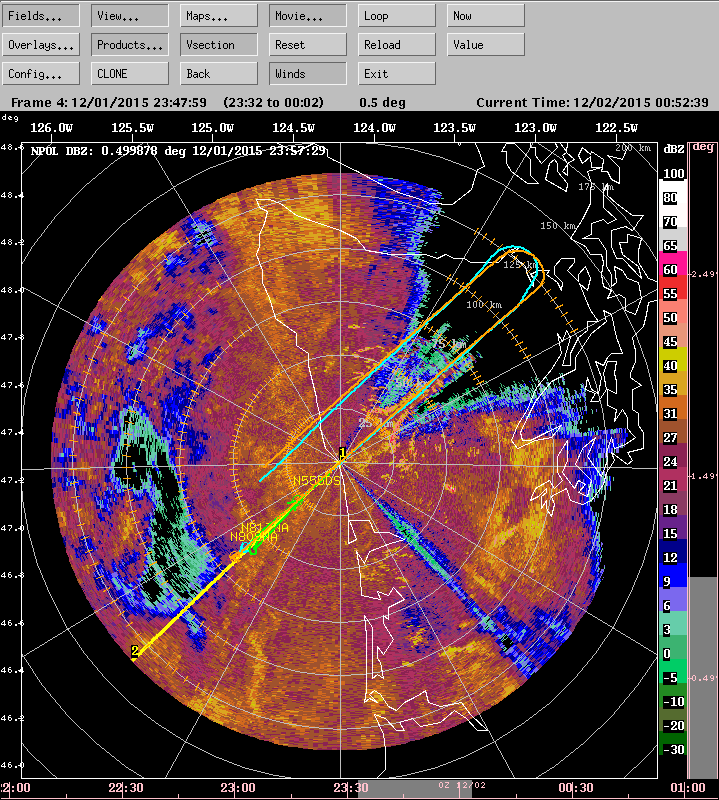
The three OLYMPEX/RADEX aircraft flew coordinated
missions for several hours over and within the broad
stratiform frontal cloud as it passed over the mountains
(Figure 5). Data were
obtained on both the windward and lee sides of the
range. Note how the flights sampled the rain shadow area
around 2100 UTC near the Environment Canada site and
Hurricane Ridge and then concentrated on
southwest-northeast tracks over the the NPOL, D3R and
DOW radars and and upstream over the ocean. These
flights were well coordinated with the RHI sector
scanning of these three dual-Polarimetric radars. The
Citation executed several spiral patterns in the
stratiform precipitation. The ER2 CPL lidar showed the
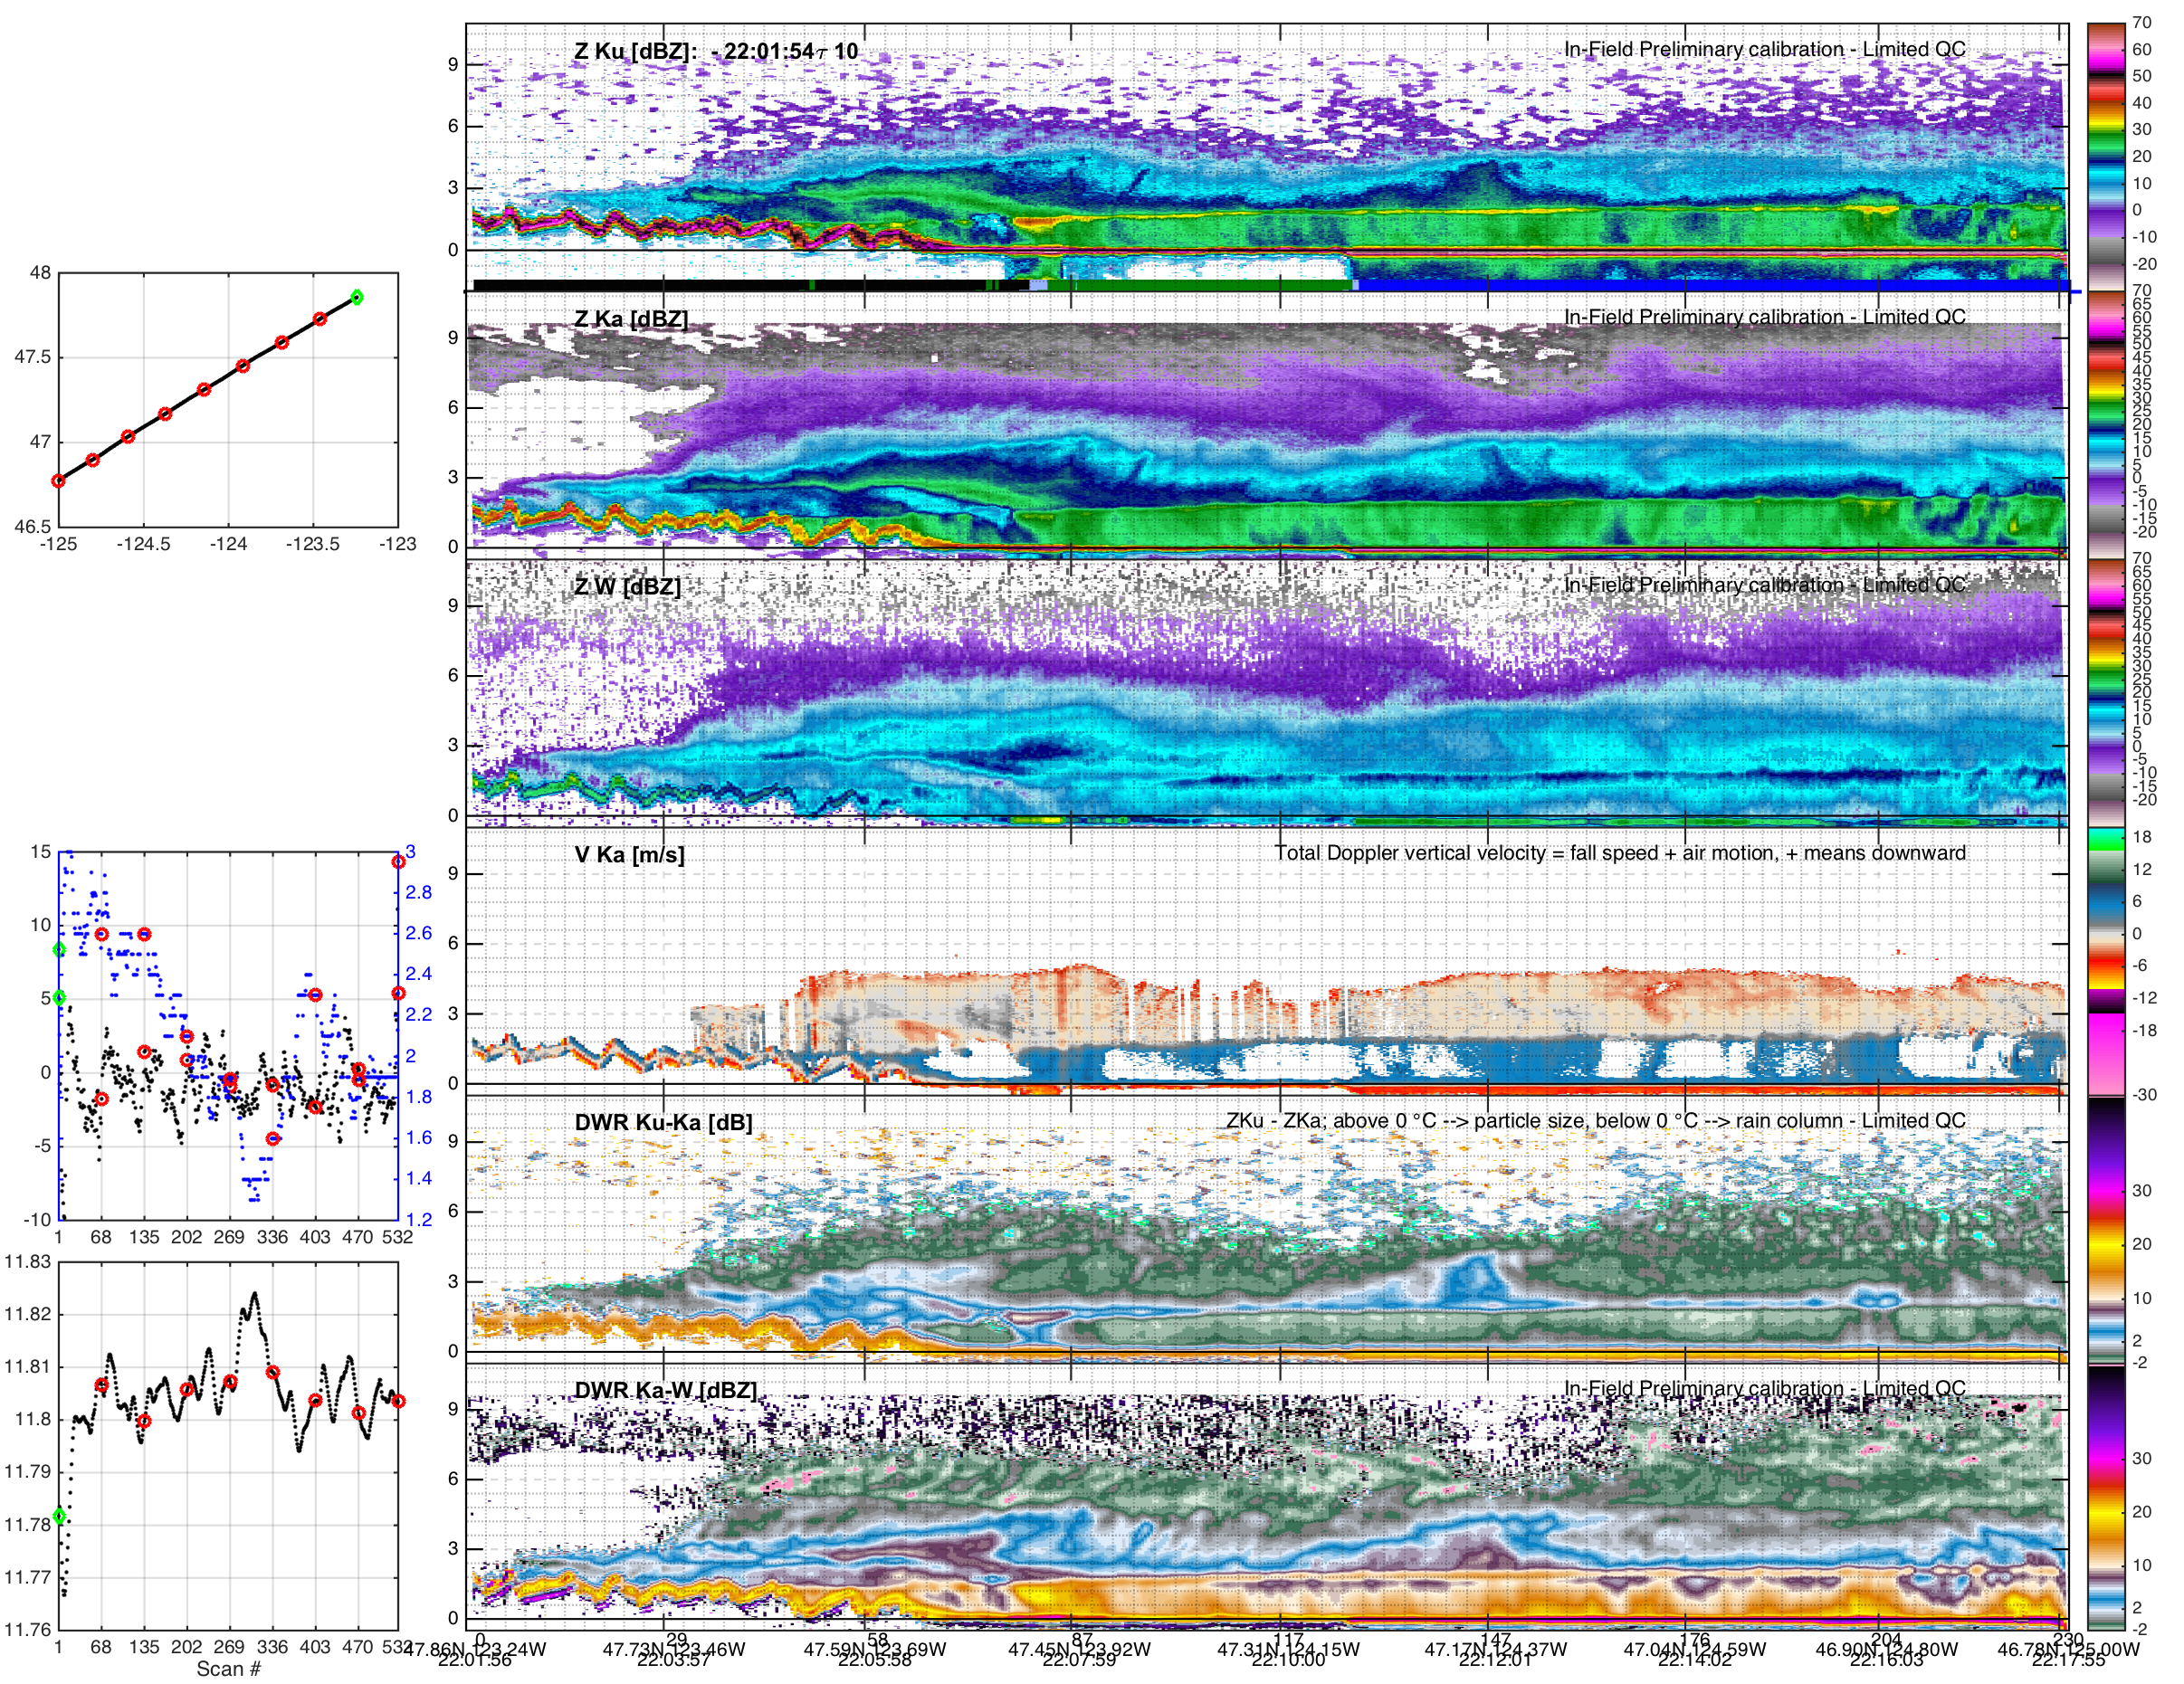
cloud top over the frontal system to be at 12 km (Figure 6). The APR2 on the DC8
obtain numerous cross sections of data. For example, Figure 7 shows the stratiform
character of the main frontal precipitation in the right
portion of the figure. This section also shows a
stronger bright band near the terrain and suggest
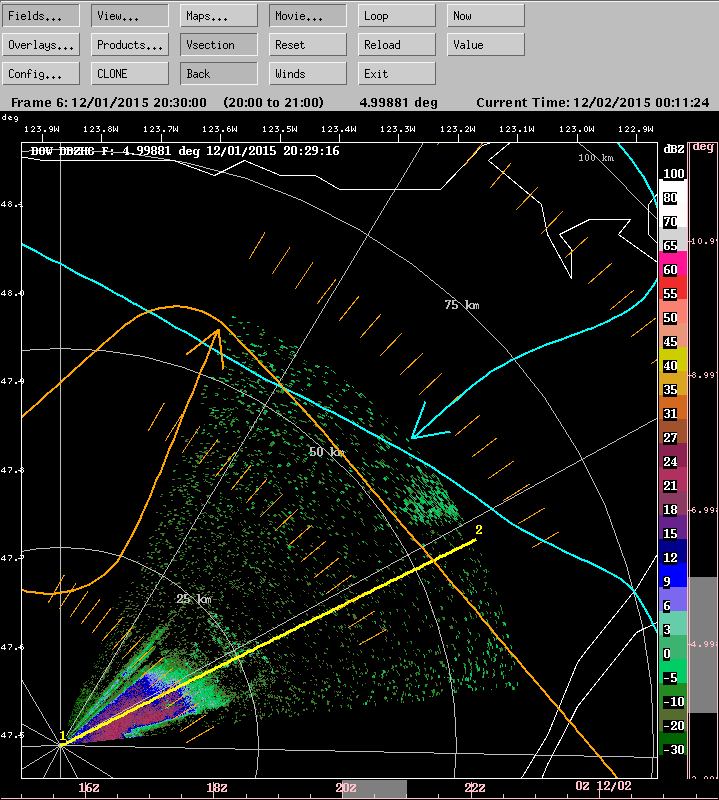
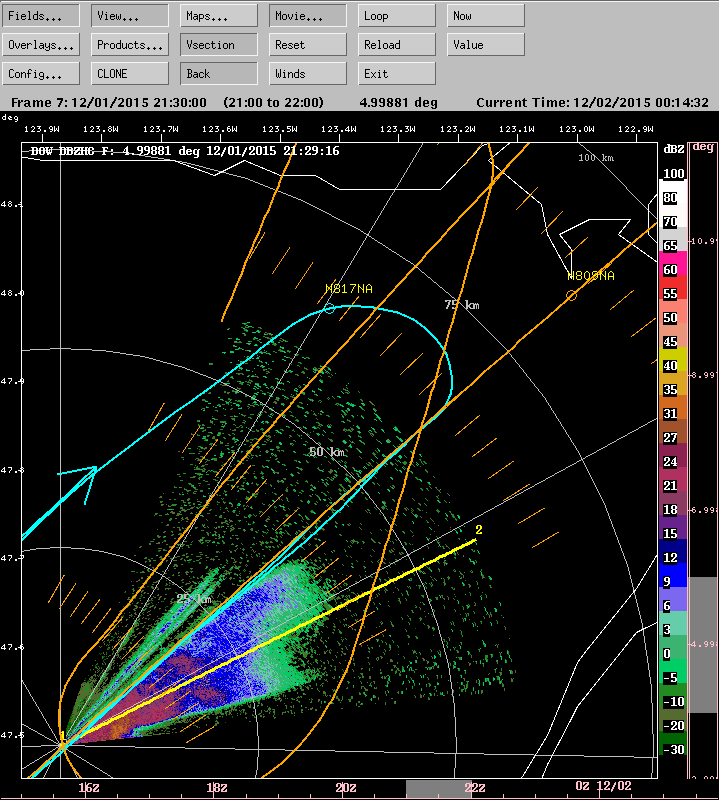
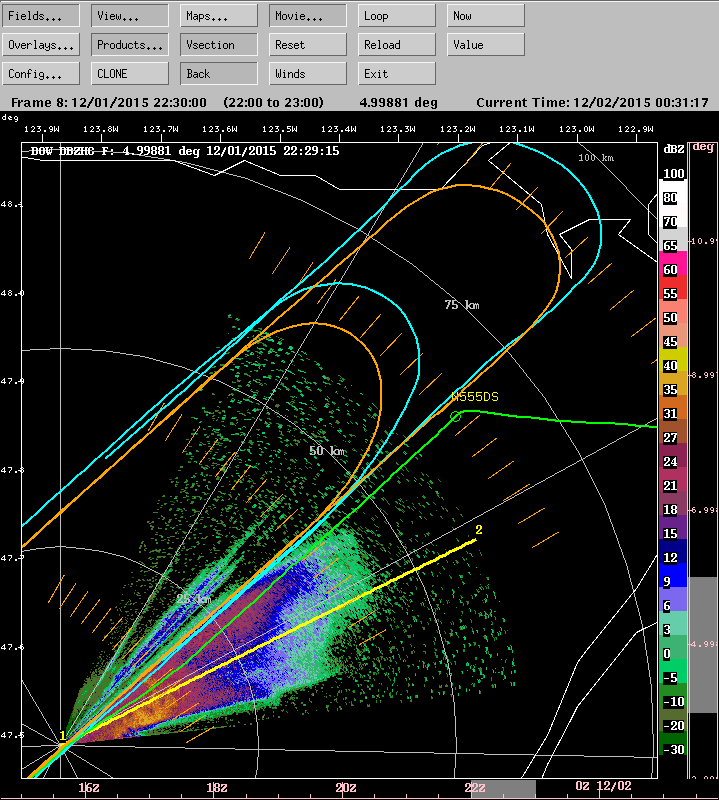
enhancement of the ice cloud layer over the terrain. Figure 8 shows how all
three aircraft coordinated over the DOW radar sector
over the Quinault Valley, where orographic enhancement
was occurring.
While the aircraft were obtaining remote sensing and in
situ measurements, the vertical structure of the
precipitation was being documented by the three dual
polarimetric radars on the windward side of the
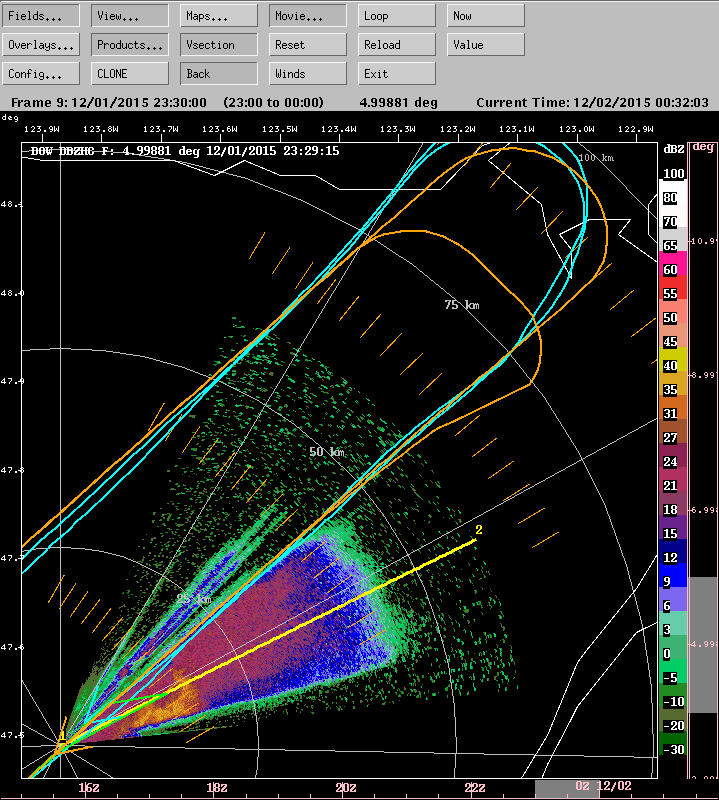
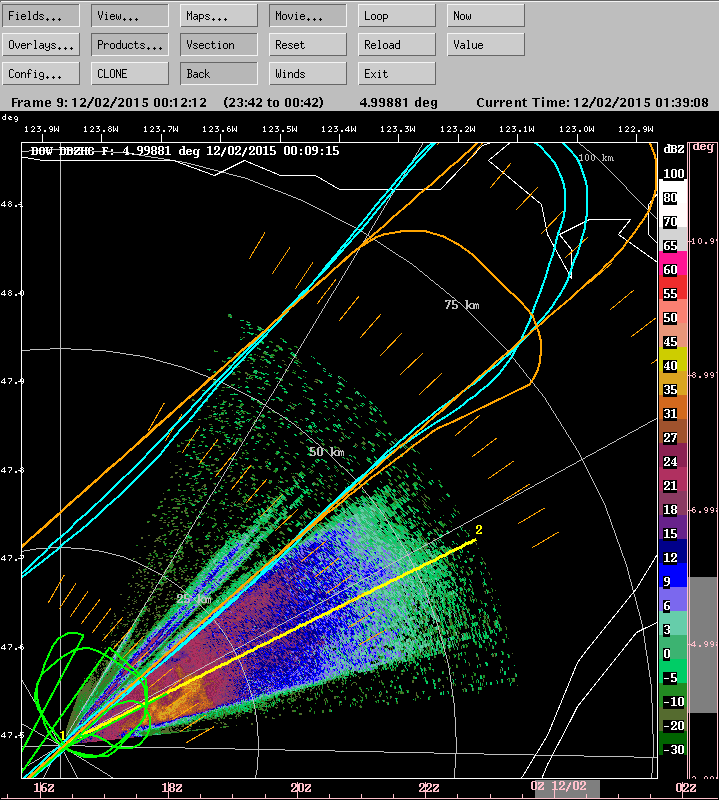
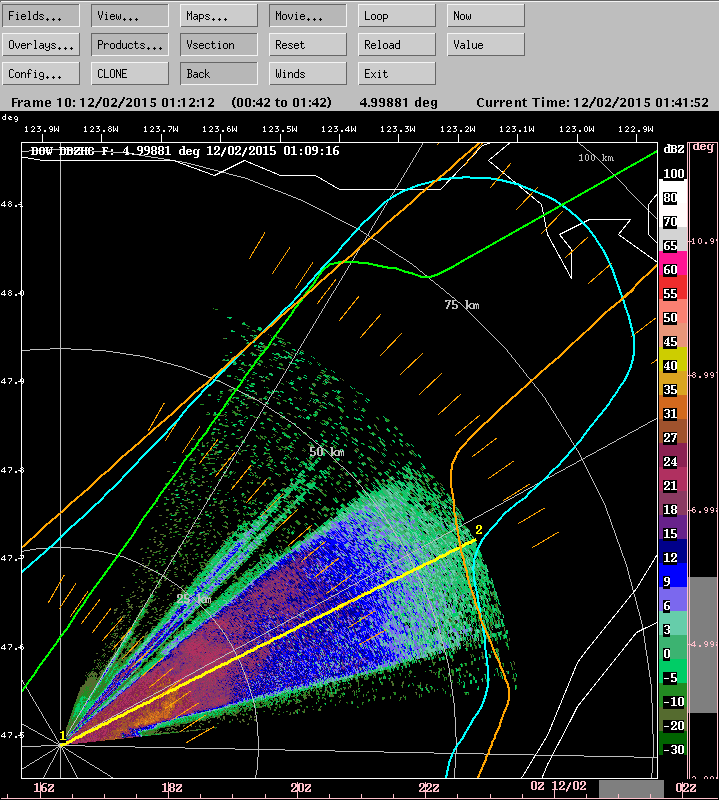
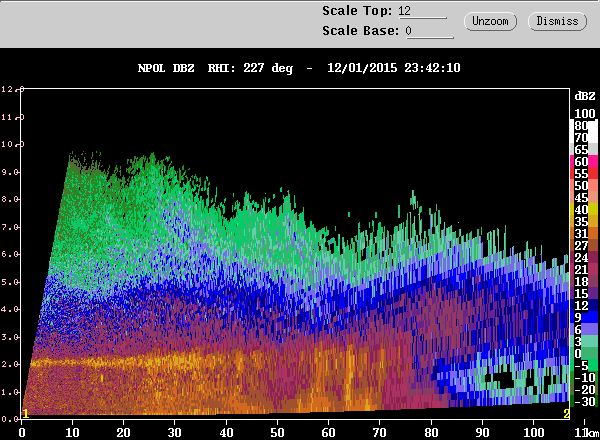
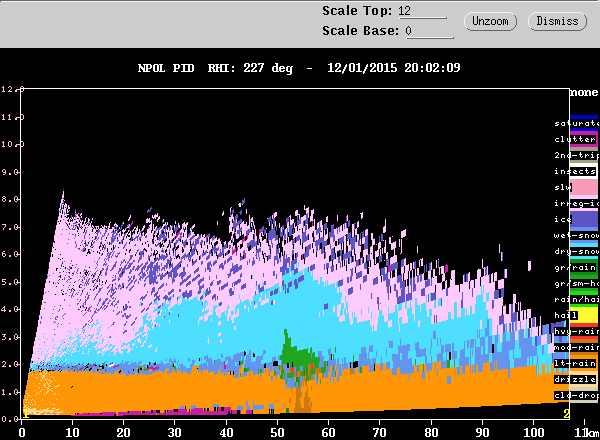
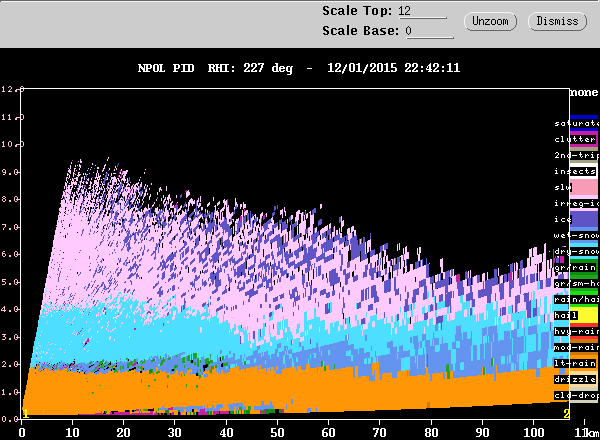
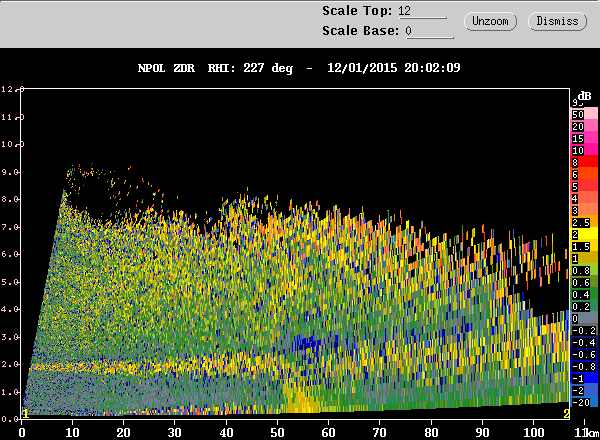
mountains. Before the time of the flights, the NPOL
radar showed that the incoming frontal precipitation was
mostly stratiform. However some pockets of embedded
convection were evident. The left column of Figure 9 show and
embedded convective cell that contained graupel (at a
range of about 55 km). Shortly after this time the
precipitation took on an almost completely stratiform
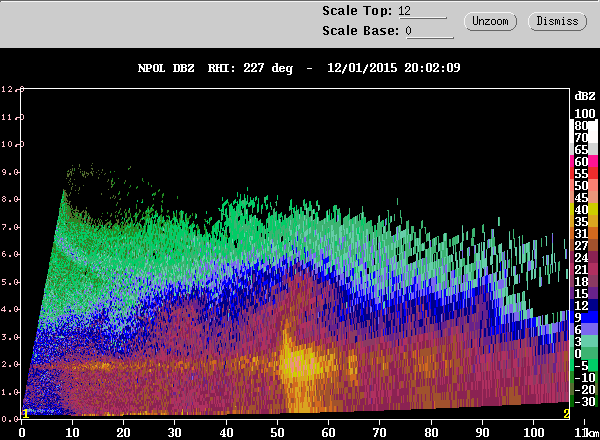
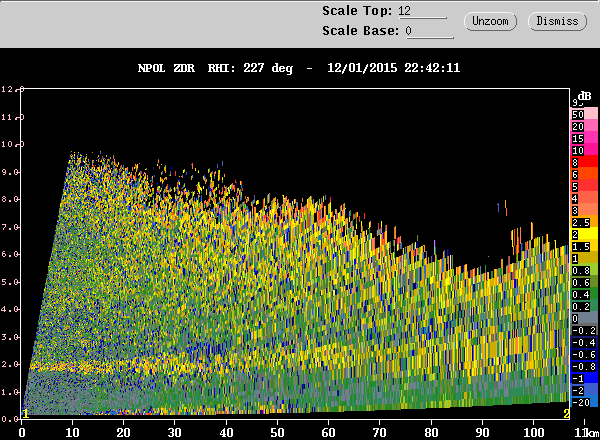
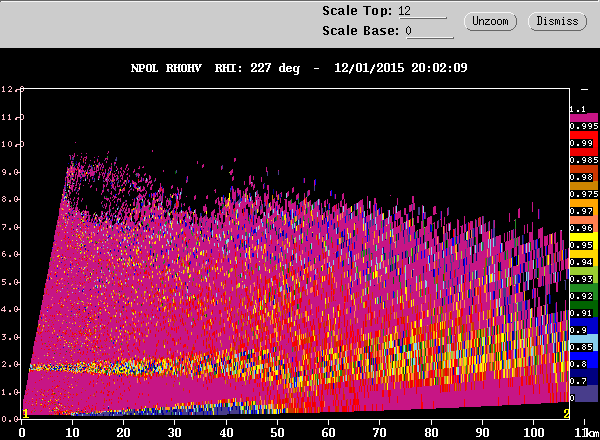
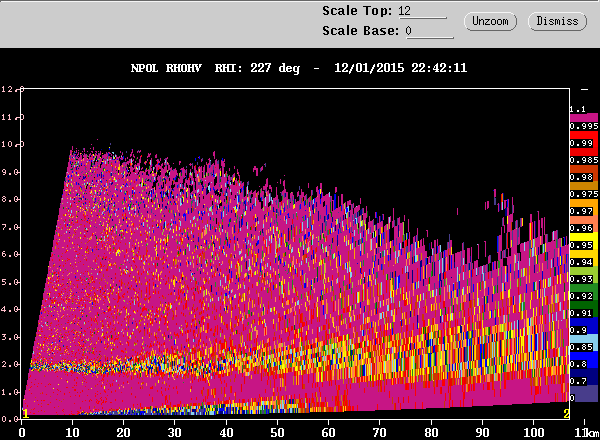
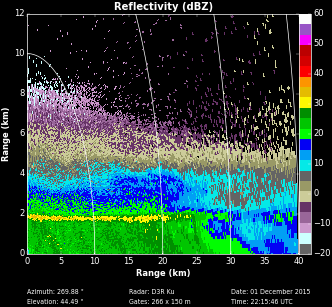
character (e.g., right column of Figure 9). The D3R RHIs in
Figure 10 show the bright band and
fallstreaks, which might be remnants of earlier
convection or the result of some weak internal cellular
overturning within the mostly stratiform precipitation.
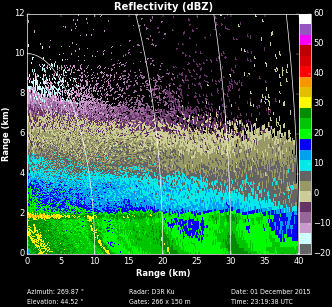
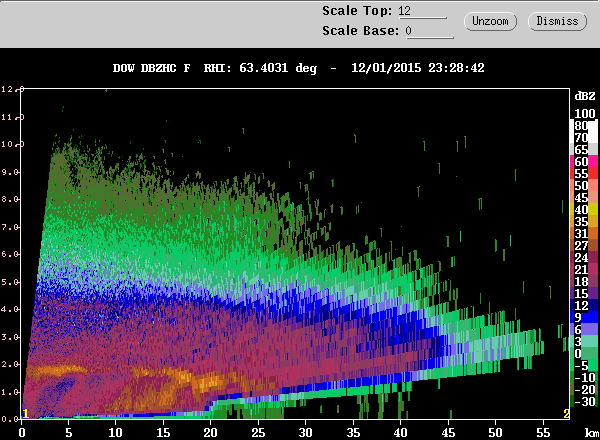
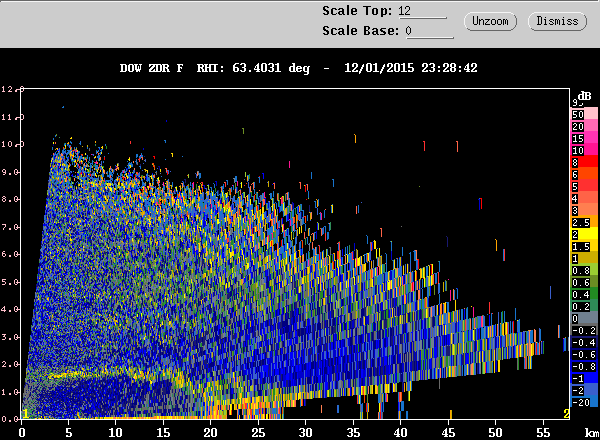
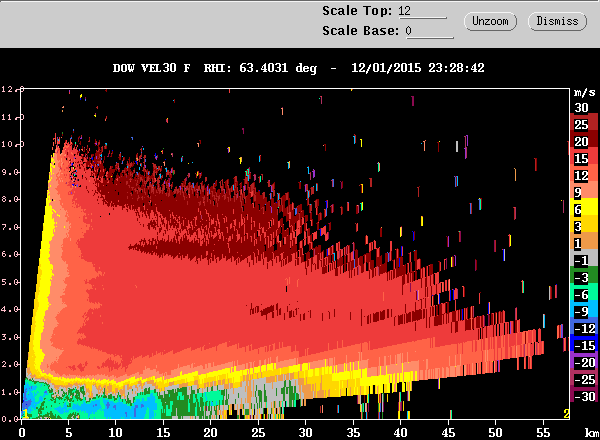
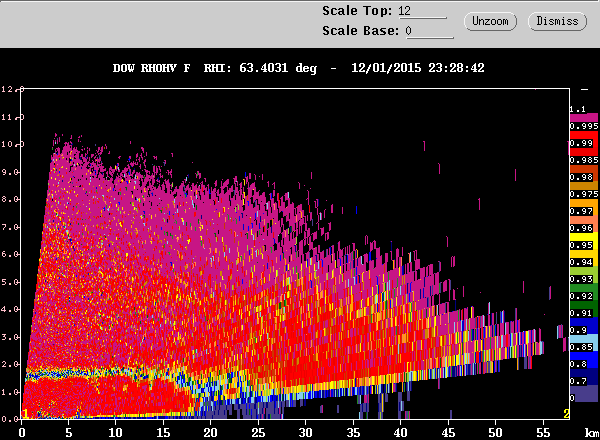
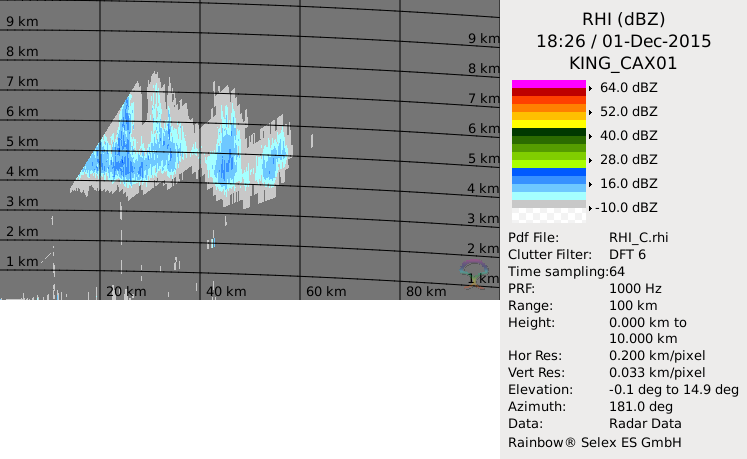
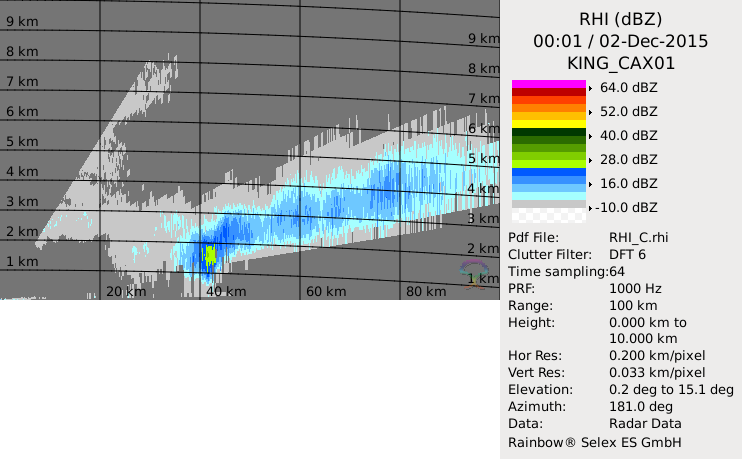
The DOW radar showed a profound effect of the mountains
on the precipitation; Figure 11
contains DOW cross sections that show the bright band
bending down sharply at the mountains, probably as a
result of forced upslope lifting and cooling. On the
northeast side of the mountain range, the EC X-band
radar initially showed weak echo aloft and a gradual
appearance of a layer of snow at Hurricane Ridge (Figure 12).
Long after the aircraft flights, the dual-polarimetric
radars continued to document the stratiform
precipitation offshore and over the mountains. Figure 13 is a PPI of Doppler
radial velocity seen by NPOL at about 0300 UTC. It shows
the classic S-profile produced by veering winds. Inland
just northeast of NPOL, there was a suggestion in the
radial velocity data of some small scale waves, but
these patterns need further analysis. The RHIs of NPOL
in show the upslope flow rising ahead of and over the
terrain, separated from a layer of downslope flow by a
layer of strong shear, as has been seen in other
mountain ranges in similar precipitation (left panel of
Figure 14). Note how the
downward bending melting layer coincides with the
upslope flow.
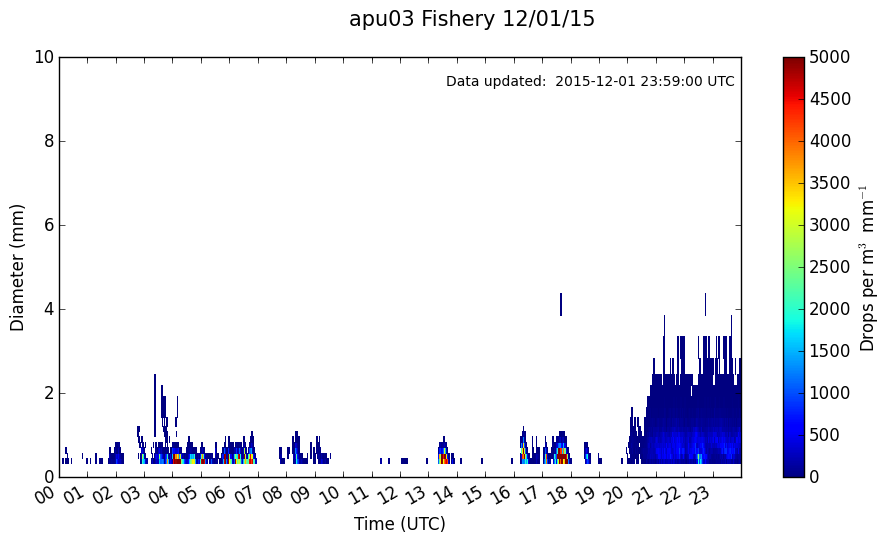
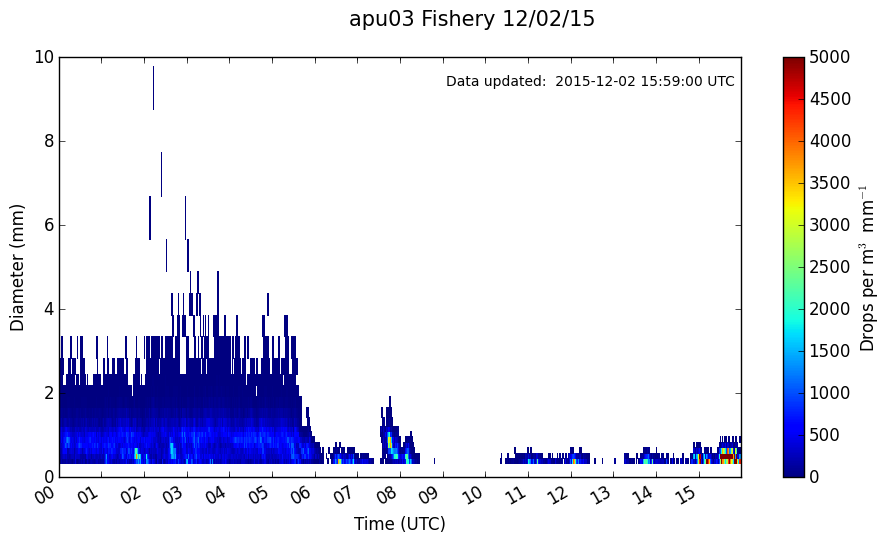
The precipitation particle size distributions showed a
pattern that is becoming familiar in OLYMPEX. The
example in Figure 15 shows that in
the early UTC hours of 1 December the drops were all
very small, associated with the warm low-level flow
impinging on the mountain range. When the main frontal
band came through between 2000 UTC on the 1st and 0600
UTC on the 2nd, the drop spectrum was broad with drop up
to ~4 mm in equivalent diameter. After the main frontal
precipitation (i.e after 0600 UTC on 2 December), the
drop spectra returned to the small-drop type.
|