During this
24 h period, the post-frontal portion of the system
observed yesterday continued to pass over the region.
In the middle of this period, the three OLYMPEX aircraft
sampled the post-frontal convection in coordinated flight patterns over both the
ocean and mountains. Before and after the aircraft
sampling period, the OLYMPEX radars and ground sites
continuously observed the evolving pattern of
post-frontal convection until the end of the 24 h
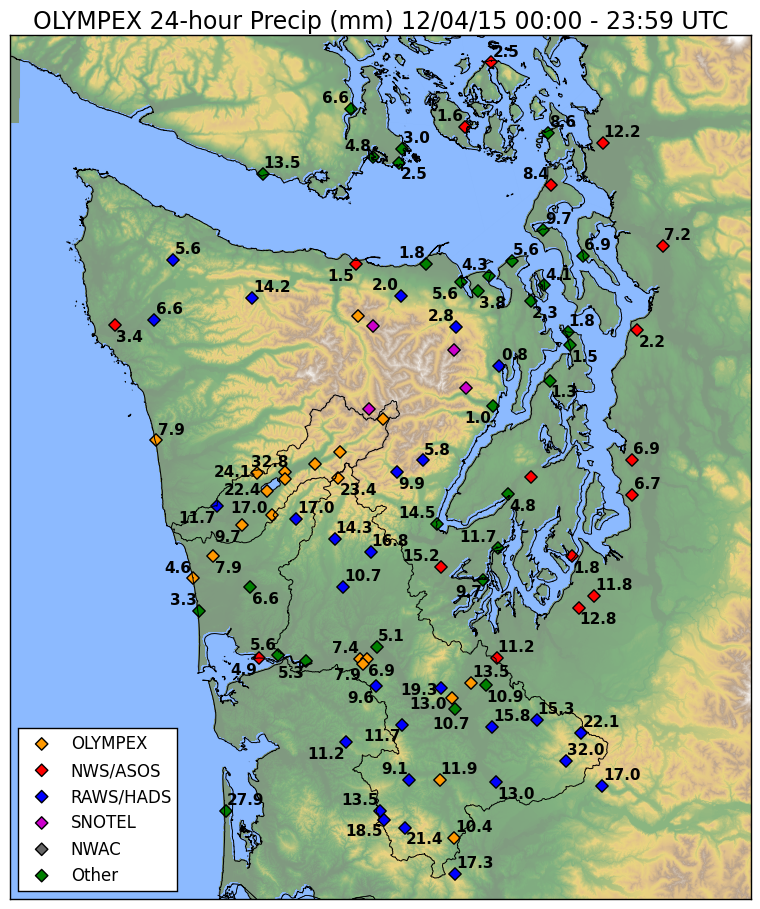
period. The largest precipitation accumulations were in
the Quinault Valley (Figure 1).
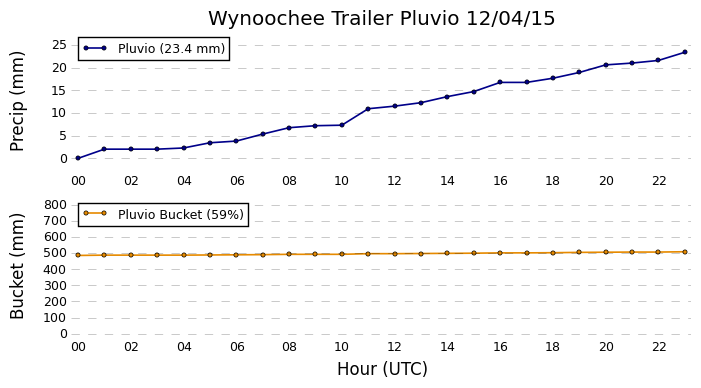
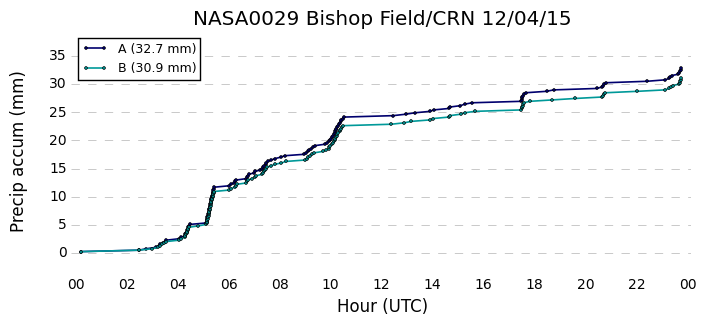
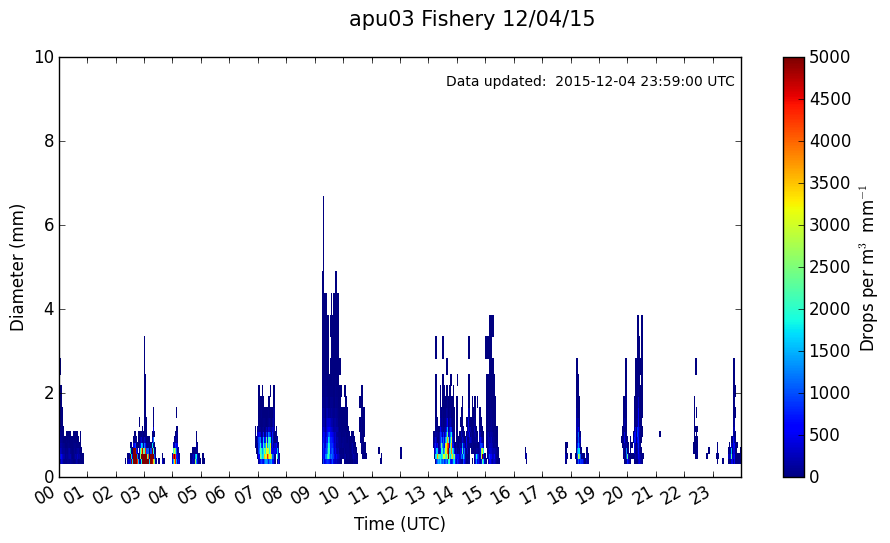
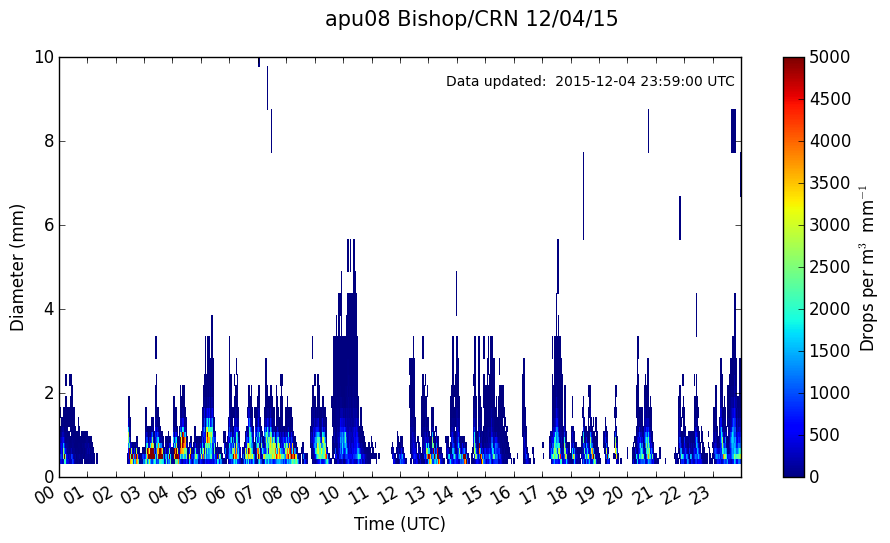
Precipitation was accumulating over the region during
the entire period (top row of Figure
2). The drop sizes (middle row of
Figure 2) were generally small except around 1000
UTC when a deeper mesoscale post-frontal band was
passing over the sites (see satellite discussion below).
The characteristics of the drop size distributions was
similar down-valley (Fishery) and up-valley
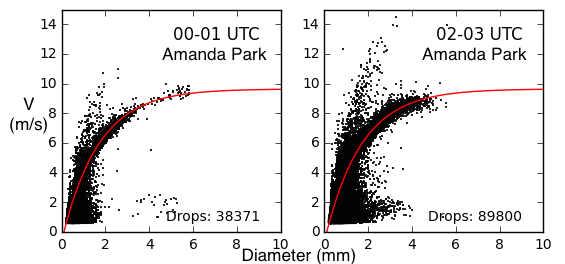
(Bishop/CRN). Near the end of the 24 h period and at
beginning of 5 December graupel showers occurred (note
the fall speed > 10 m/s in bottom
panel of Figure 2).
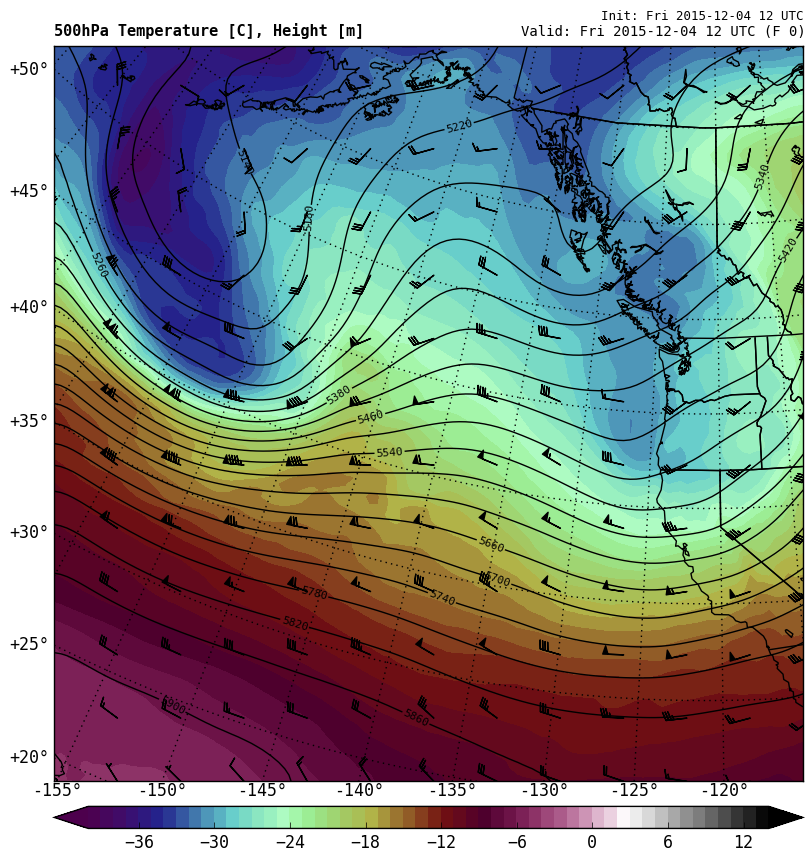
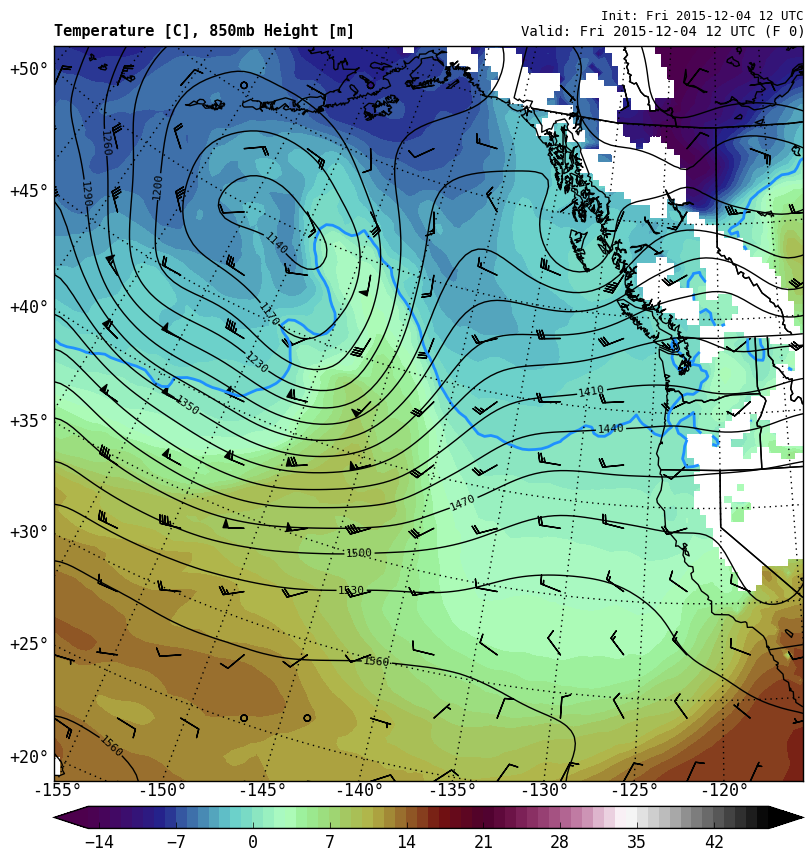
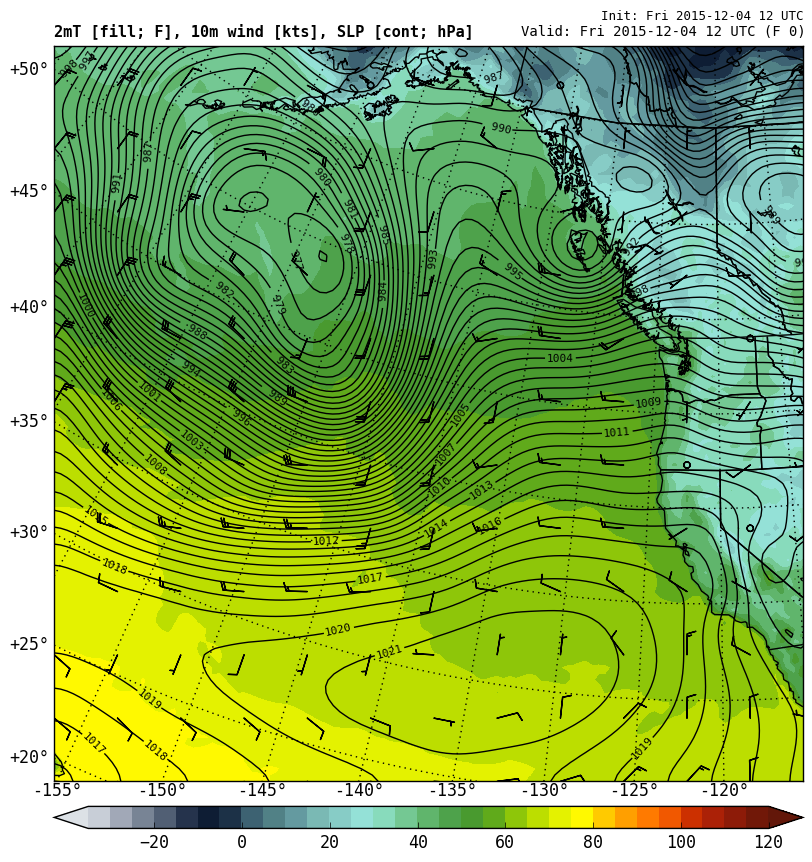
The post-frontal convection was occurring as the cold
air in the trough at 500 hPa and 850 hPa was passing
over the OLYMPEX area (left and middle panels of Figure 3). The surface flow was
westerly, and the low-level temperature gradient was
slight (right panel of Figure 3).
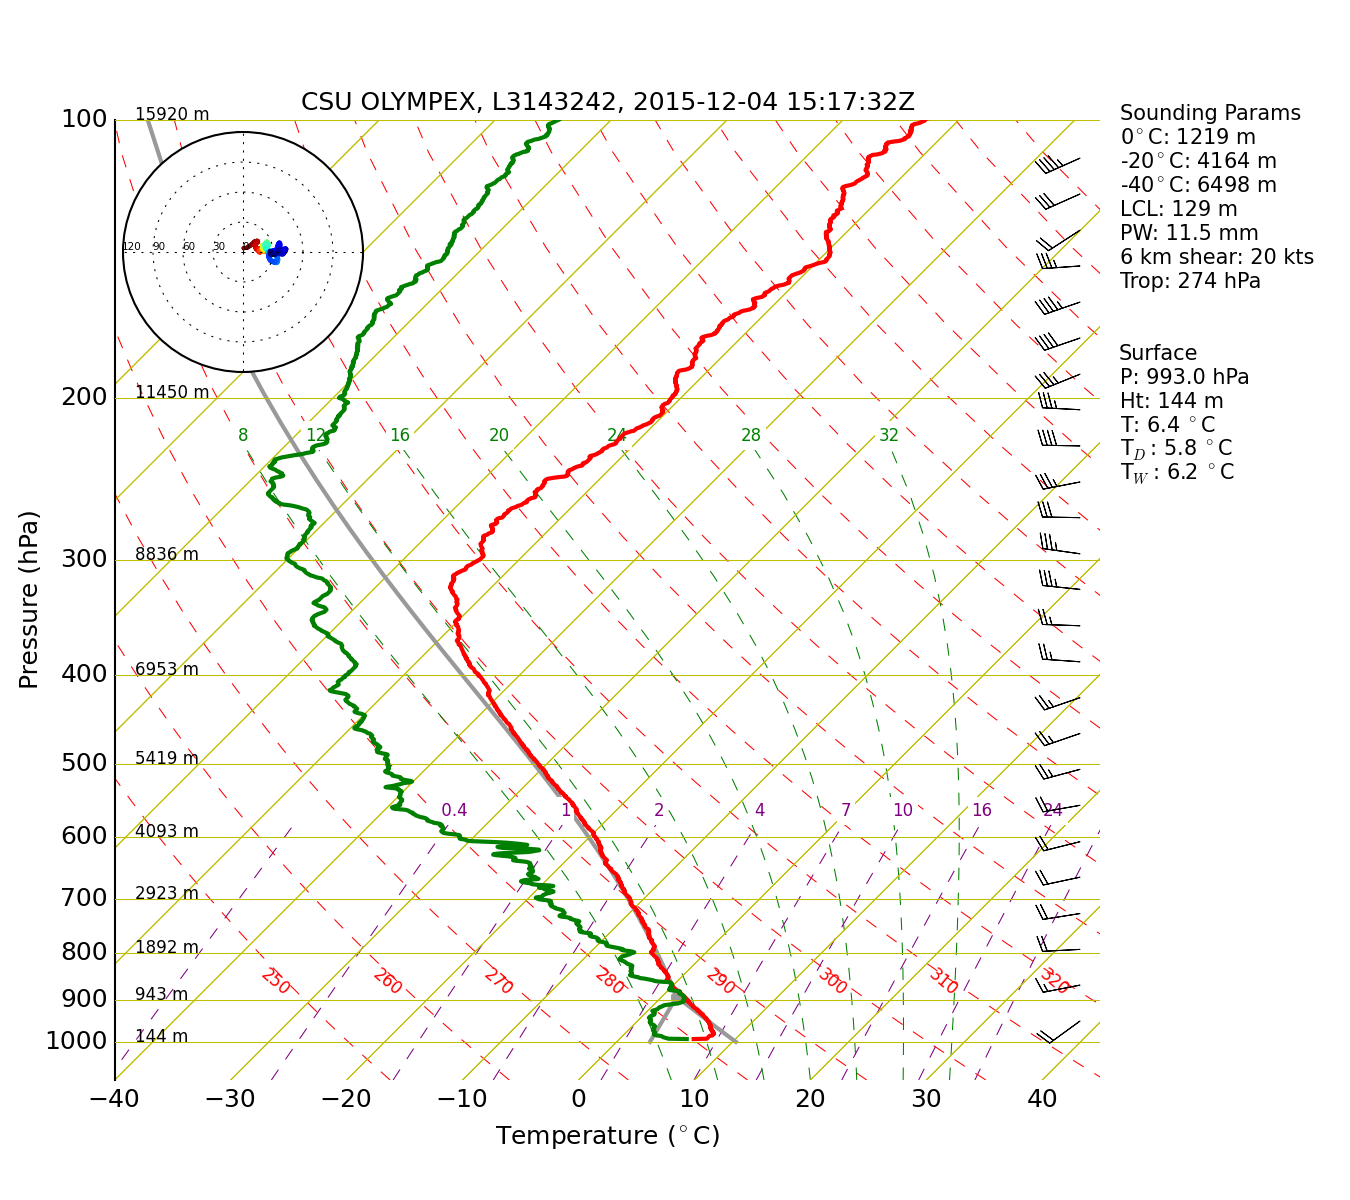
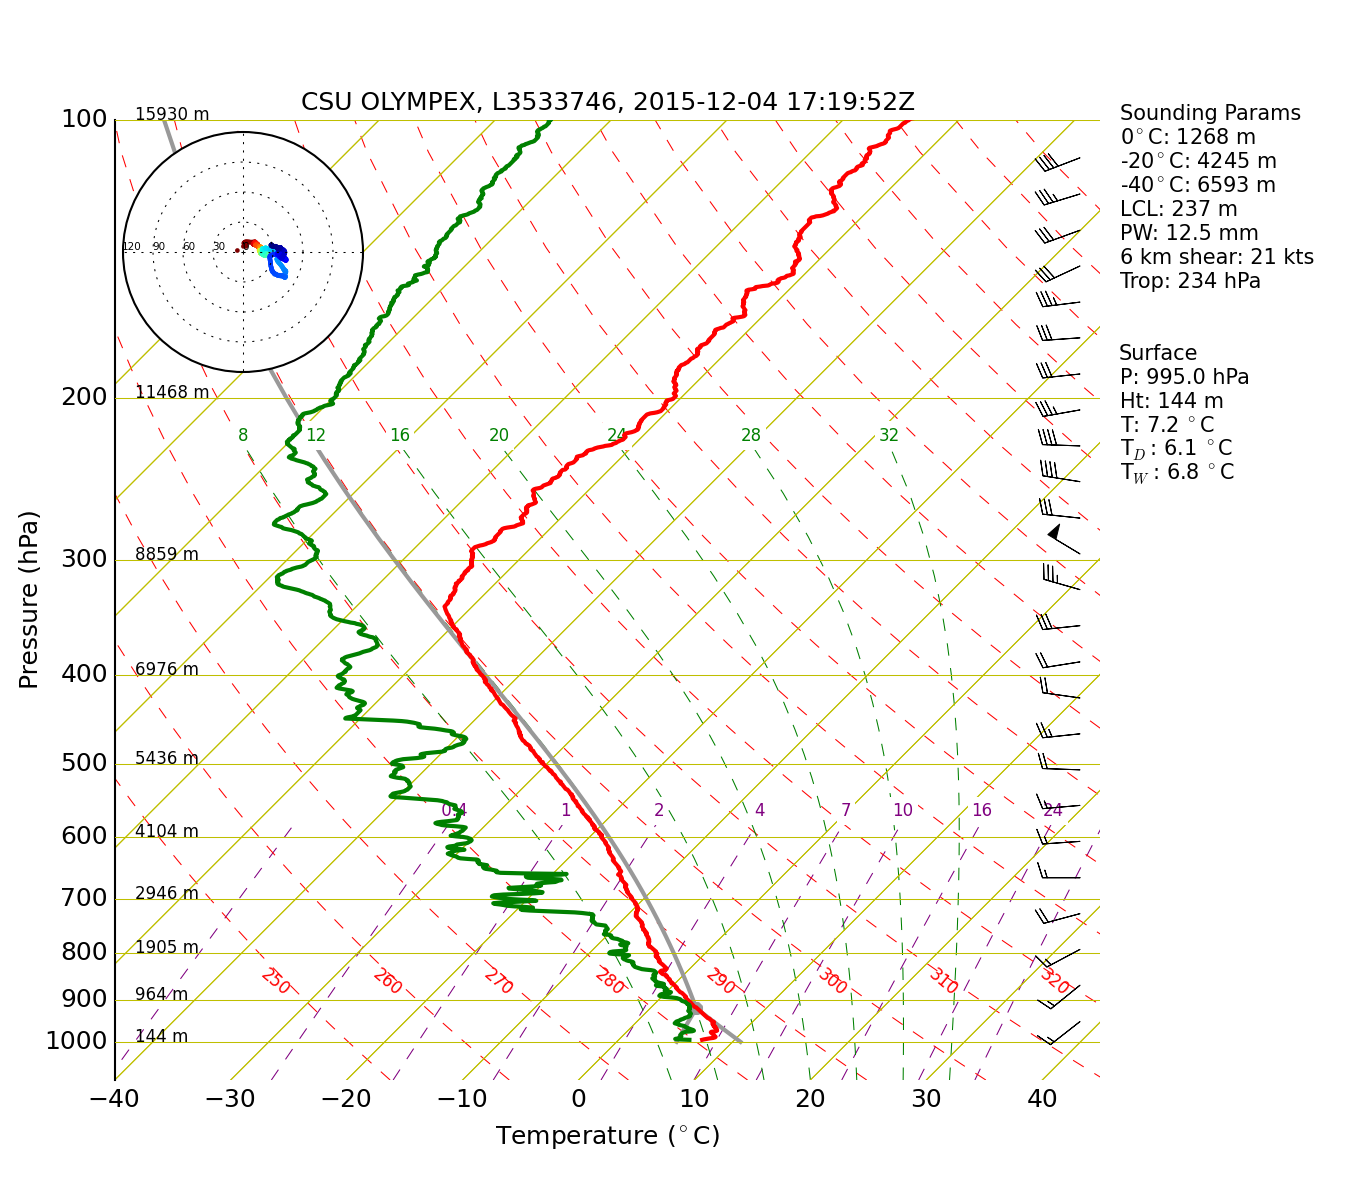
The soundings at NPOL during the time of the aircraft
missions (Figure 4) showed
instability below 600 hPa (~4 km).
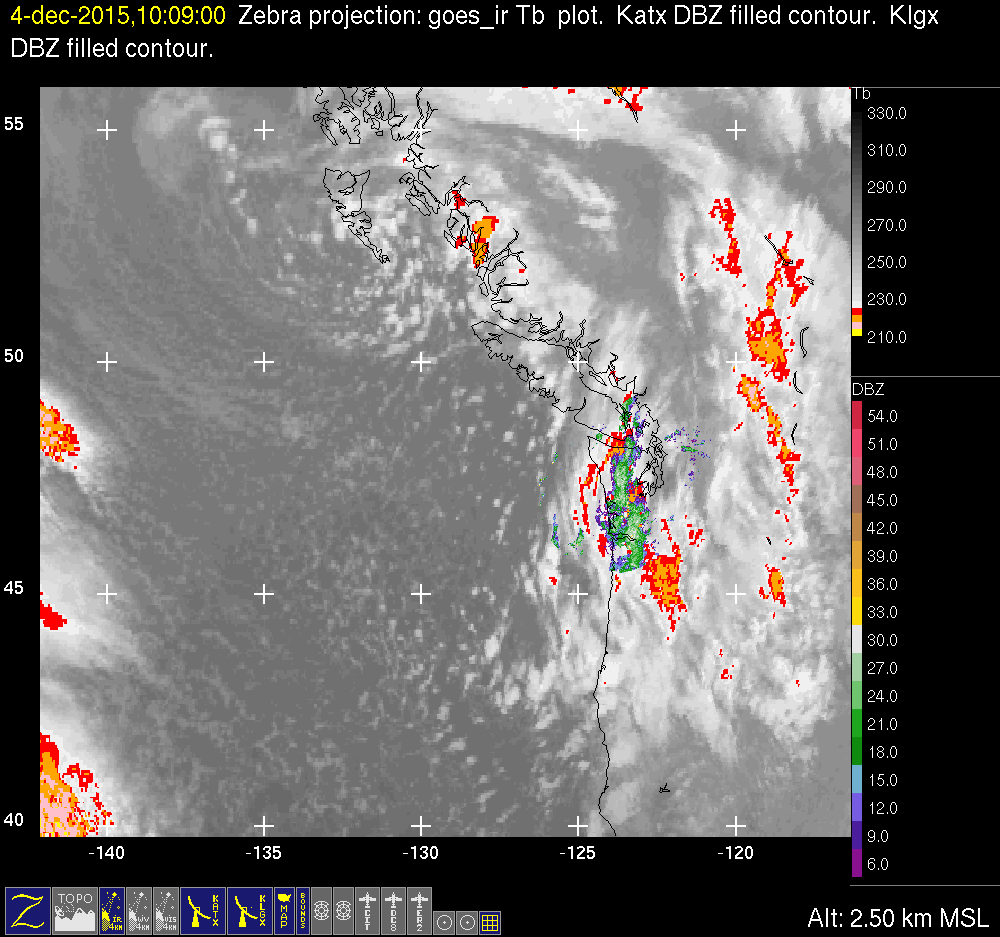
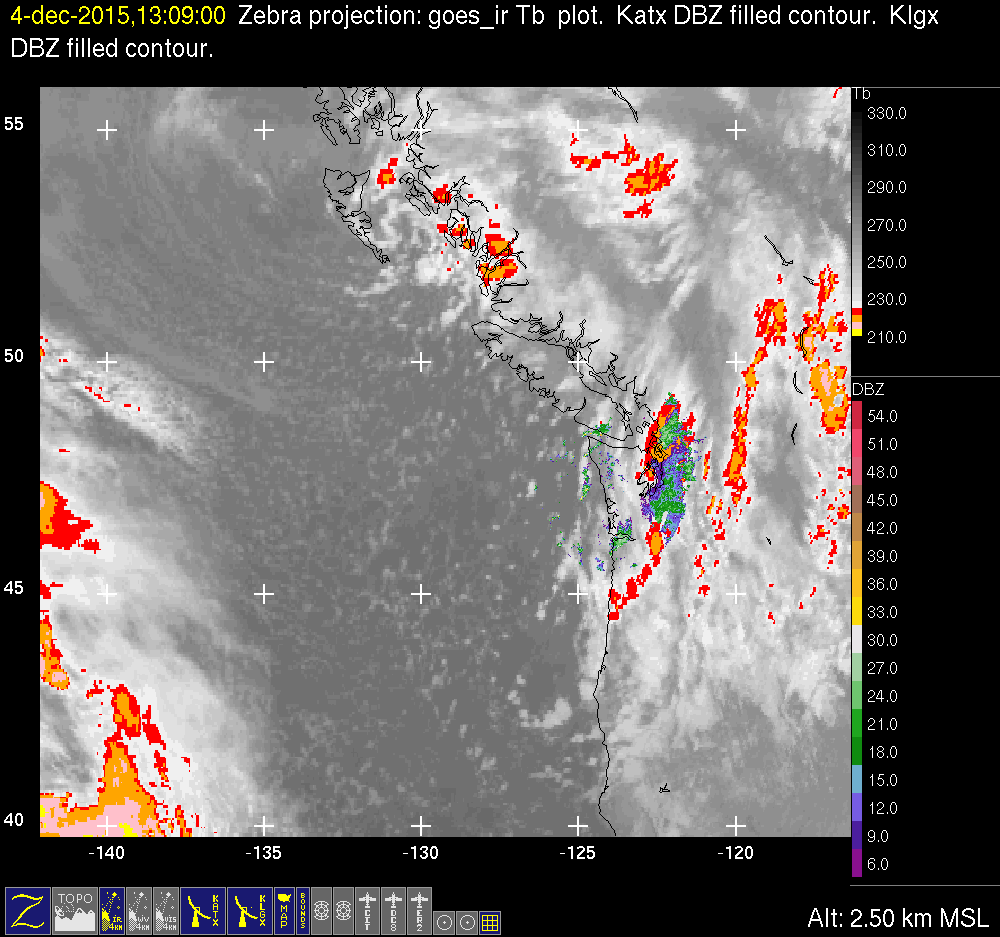
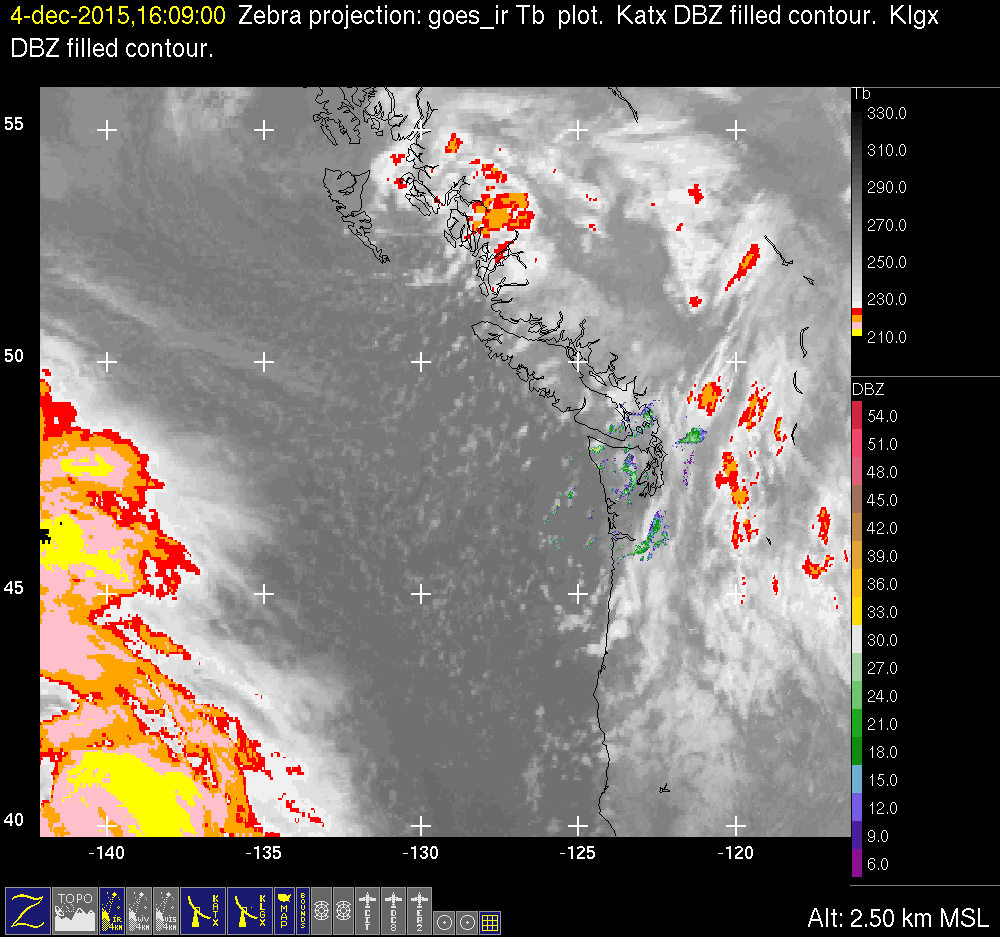
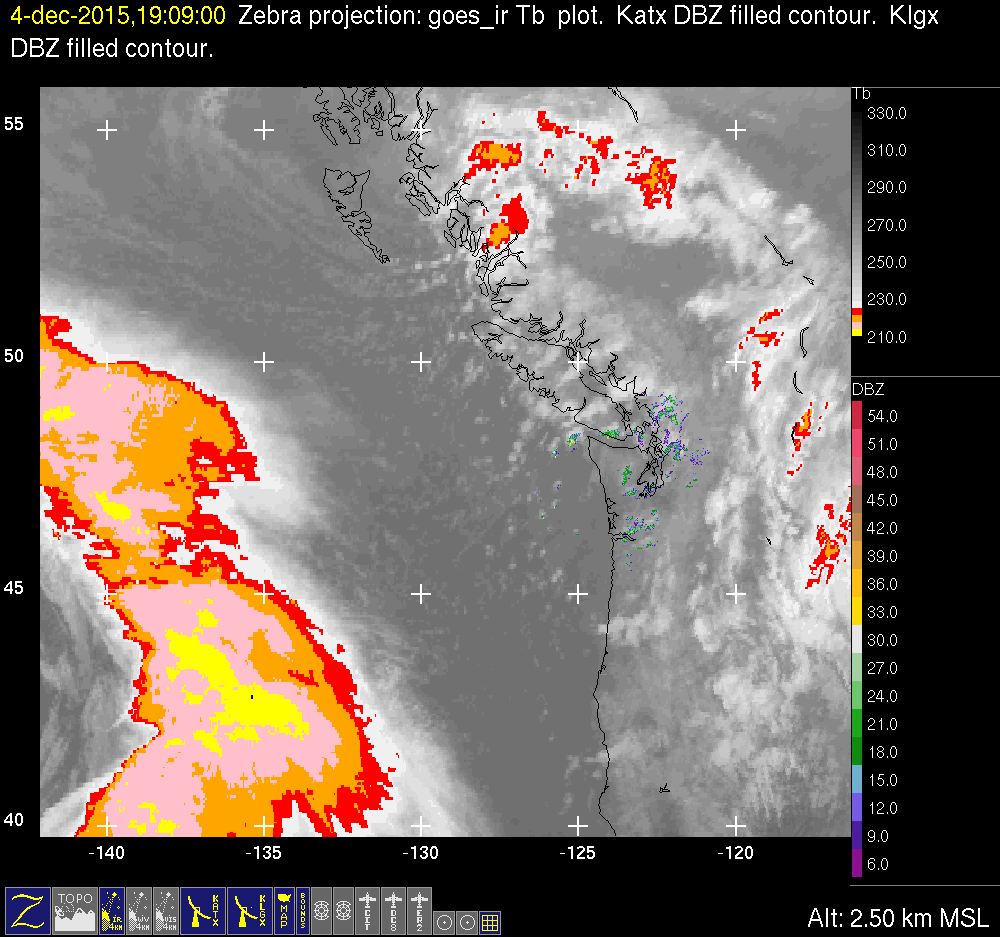
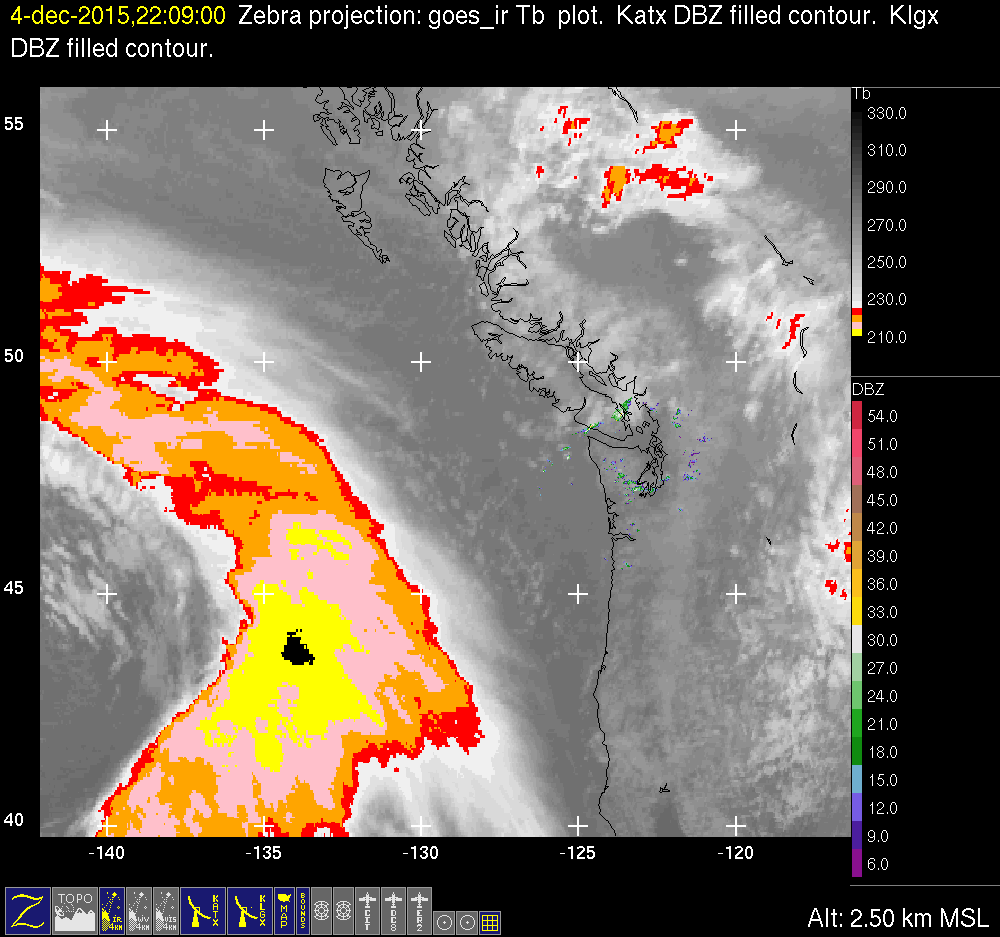
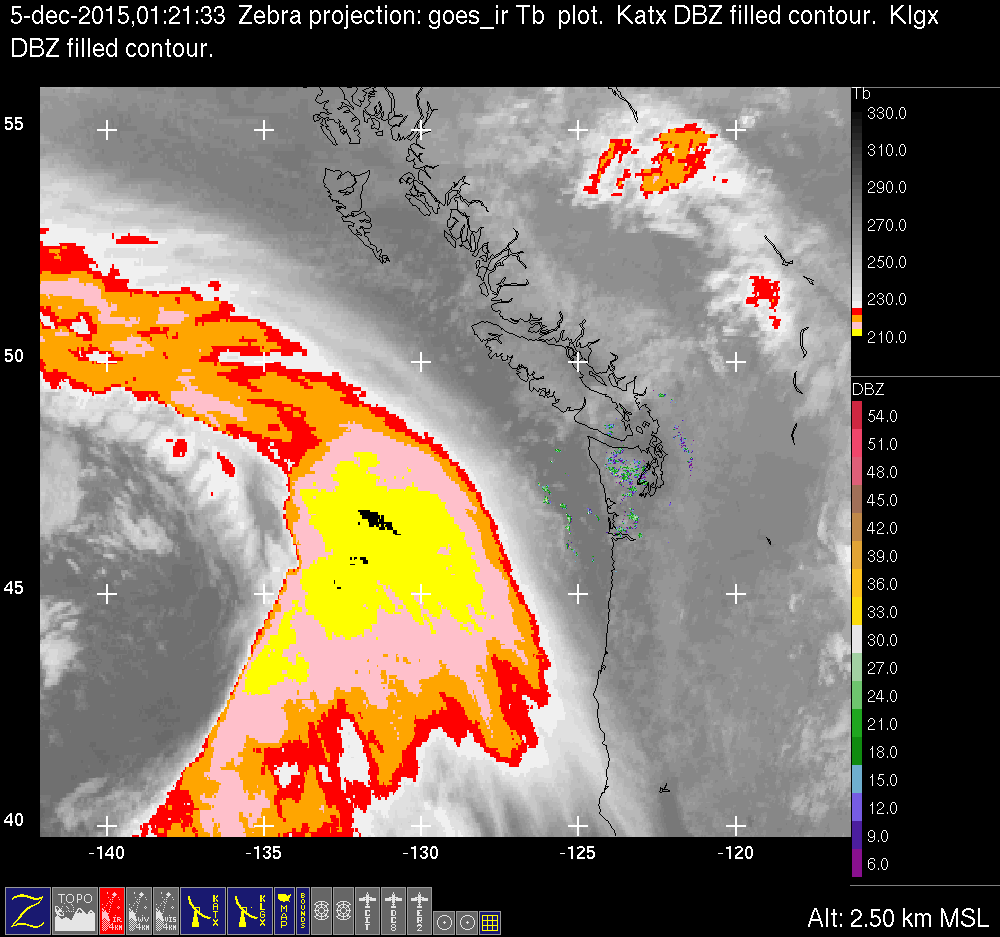
Combined infrared satellite imagery and NEXRAD radar
echoes show the progression of the post-frontal pattern
(Figure 5). At 1000 UTC a
mesoscale post-frontal rainband was over the Olympic
Mountains. The dropsize distributions at about 1000 UTC
showed a broader distribution with relatively more large
drops compared to small drops, consistent, as we have
seen in other summaries, with the deeper layer of clouds
and more drops coming from the melting of ice particles.
Synoptic analysis (not shown) suggests a vorticity
maximum at 500 hPa and hence a deeper layer of general
lifting at this time may have been responsible for the
mesoscale rainband. After 1000 UTC the broad upper cloud
layer was gone and the cloud pattern had a showery
appearance in the satellite imagery for the rest of the
24 h period. The 1300 UTC image shows the post-frontal
convection coalesced into a mesoscale north-south band.
The aircraft missions sampled this band intensively.
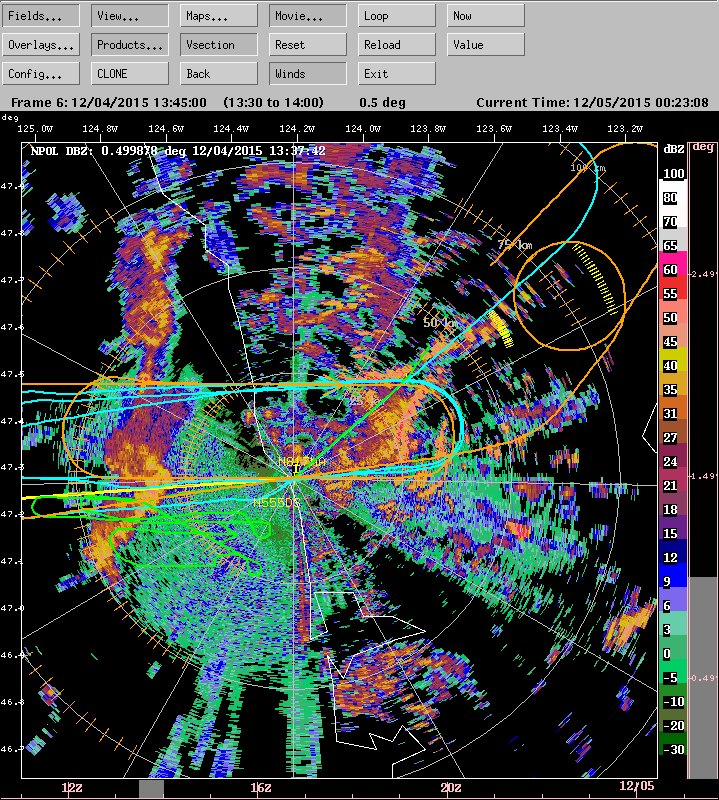
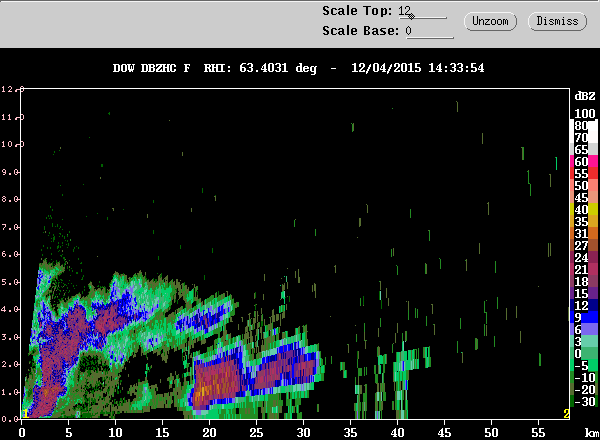
Figure 6 shows the aircraft
tracks at two times. At the first time, the aircraft
were sampling the aforementioned mesoscale cloud band
while it was over the ocean and approaching the NPOL
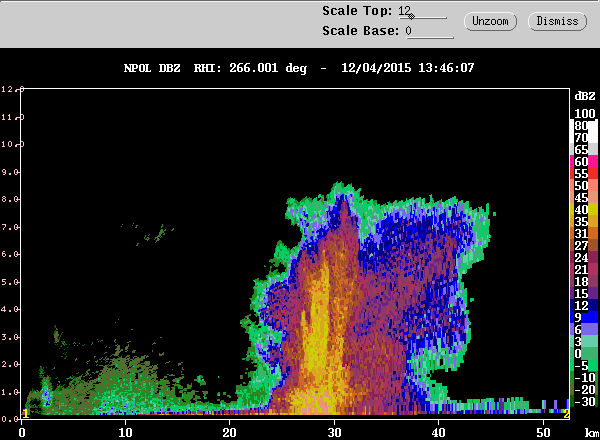
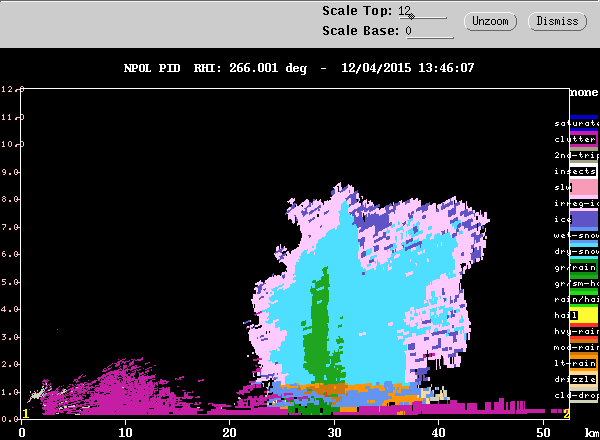
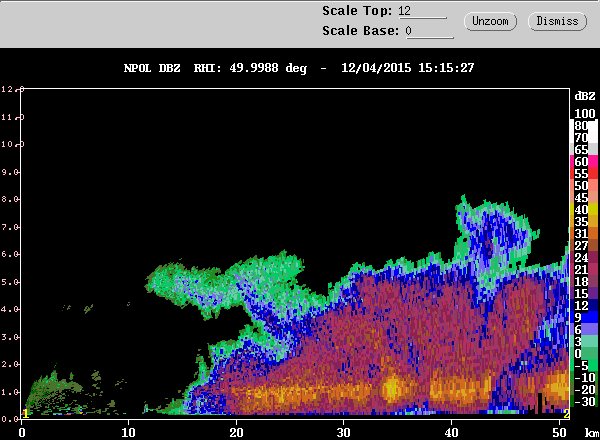
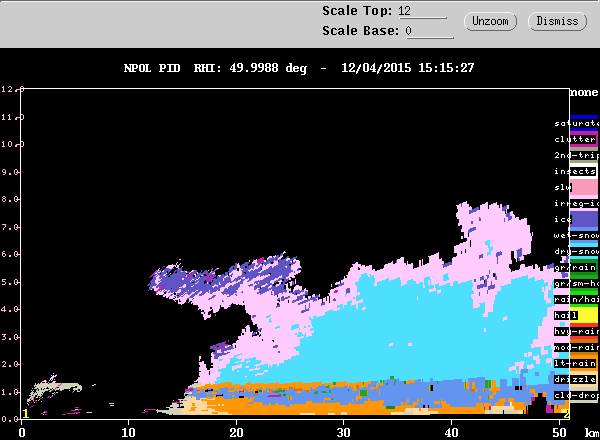
radar. The reflectivity and particle identification RHIs
at the first time show a moderately intense convective
element with S-band echo extending up to about 8 km. The
echo was ~20 km in width and its top was forming an
anvil. The particle identification shows a column of
graupel up to about 6 km. At the second time shown in Figure 6, the aircraft were
sampling the convective band while it was over land and
moving away from the radar toward the Quinault Valley.
The RHIs show that at this time the band had aged into a
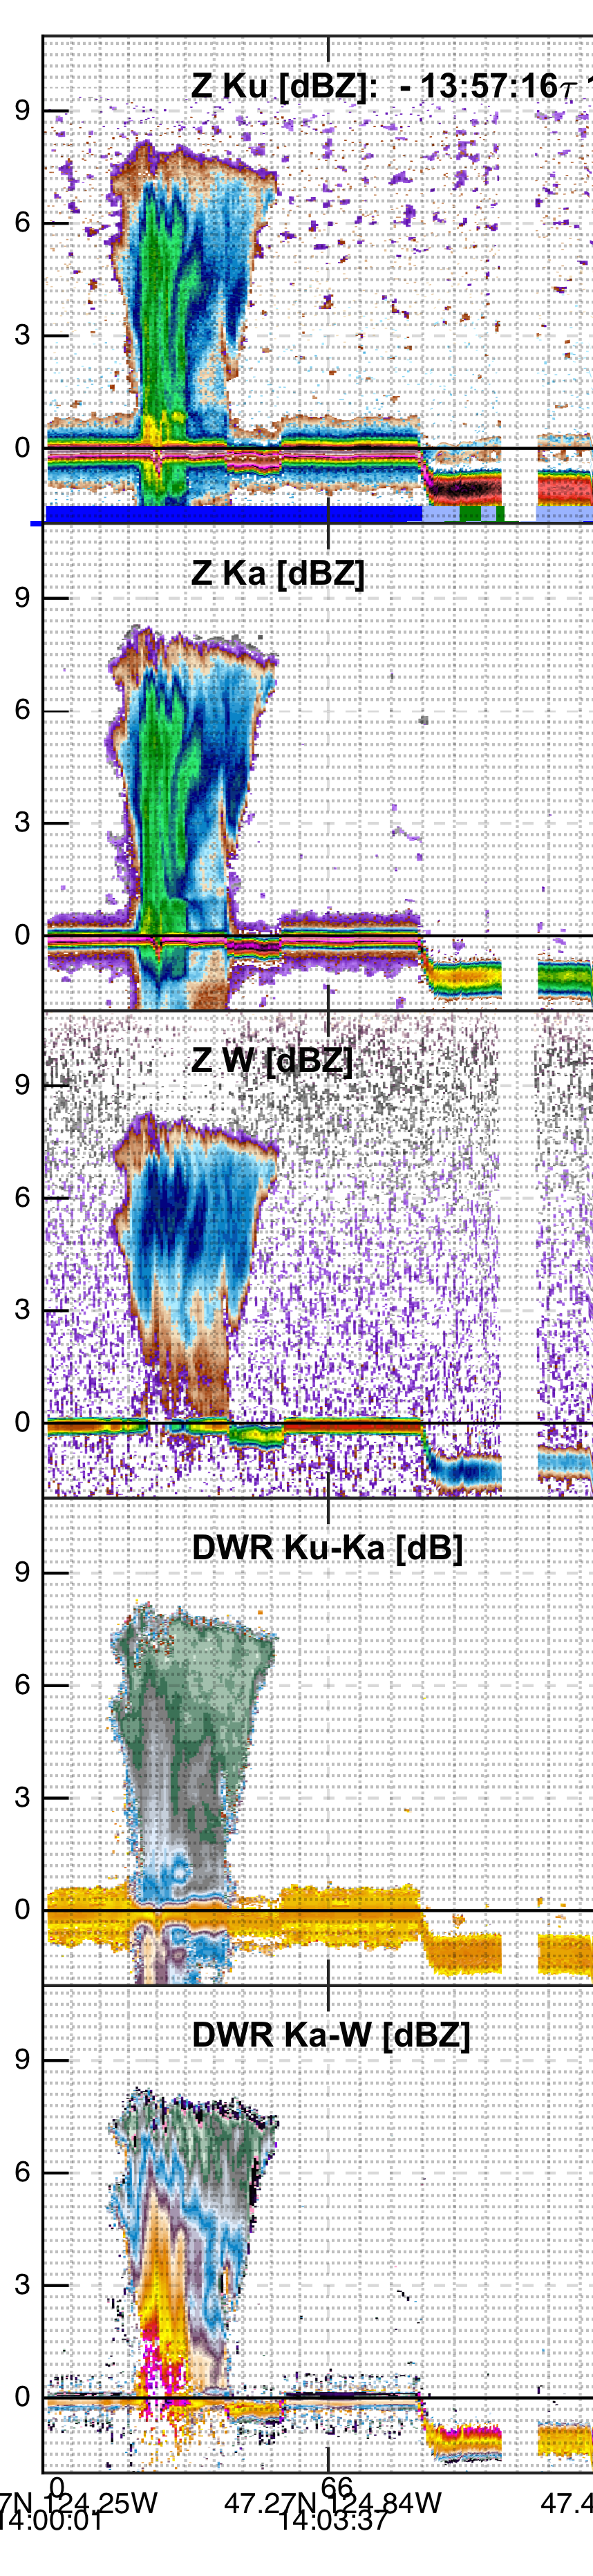
stratiform structure. When the DC8 intercepted the three
wavelength bands showed the deep convective element in
three views, which will allow multi-frequency analysis
of the echo (left column of Figure 7).
It also saw the band after it had evolved into
stratiform structure (middle column of Figure
7). During the later part of the aircraft sampling
period, the three aircraft observed shallower convection
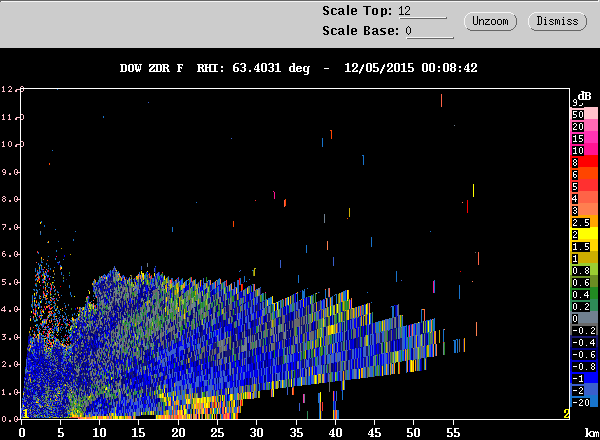
over both land and ocean (right column of Figure 7). The aircraft intensively
sampled the rainband and other convection over the DOW
radar (Figure 8).
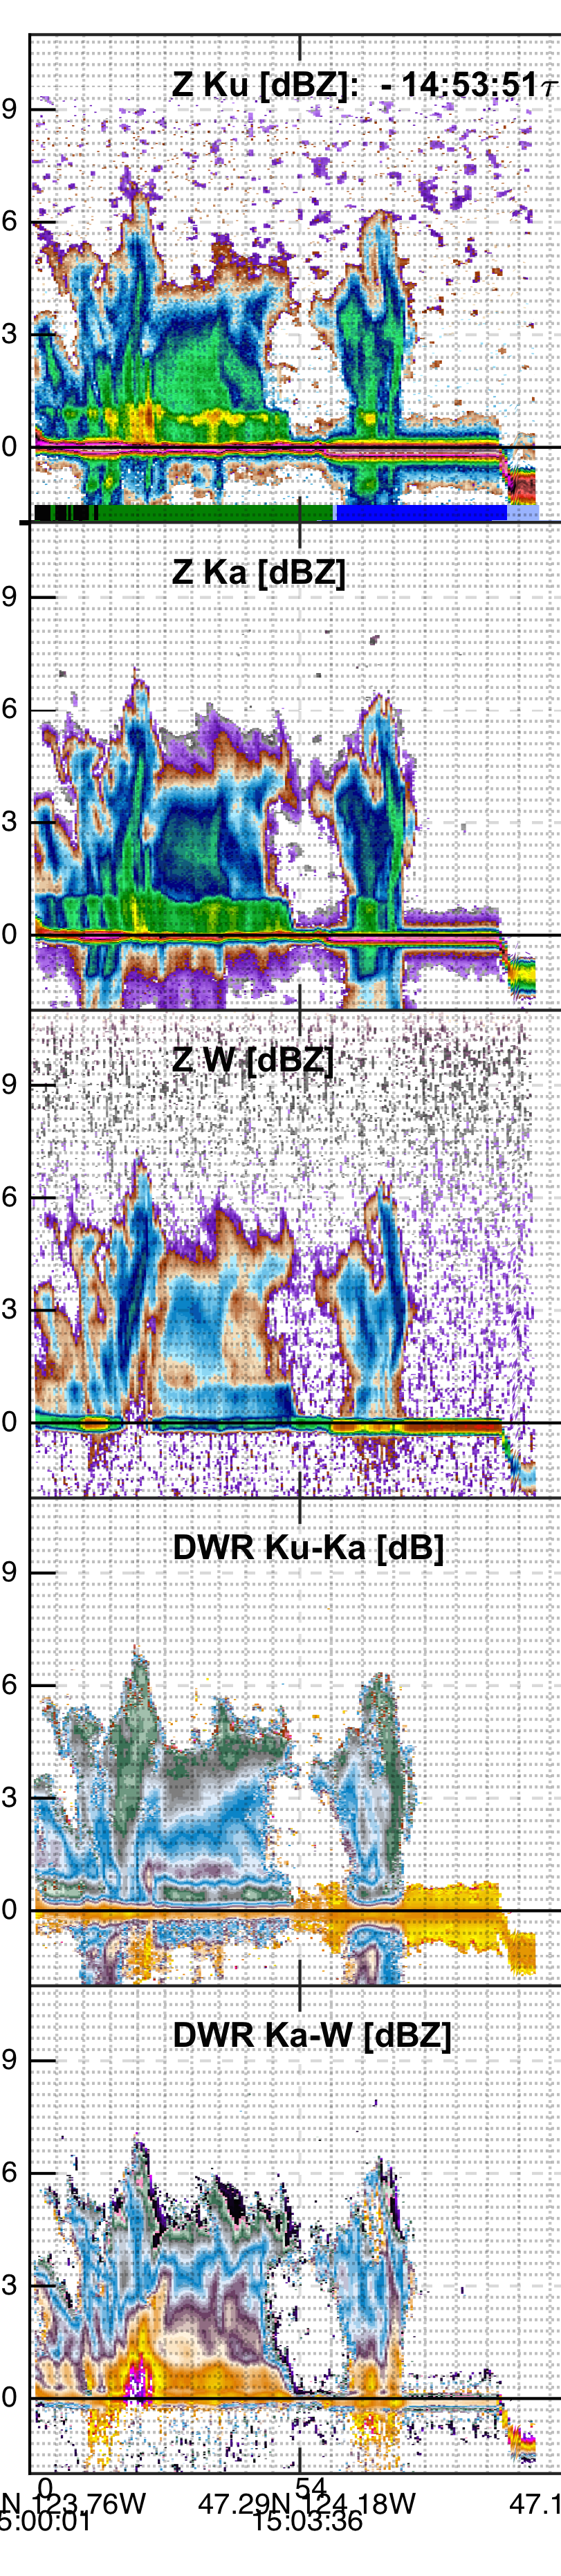
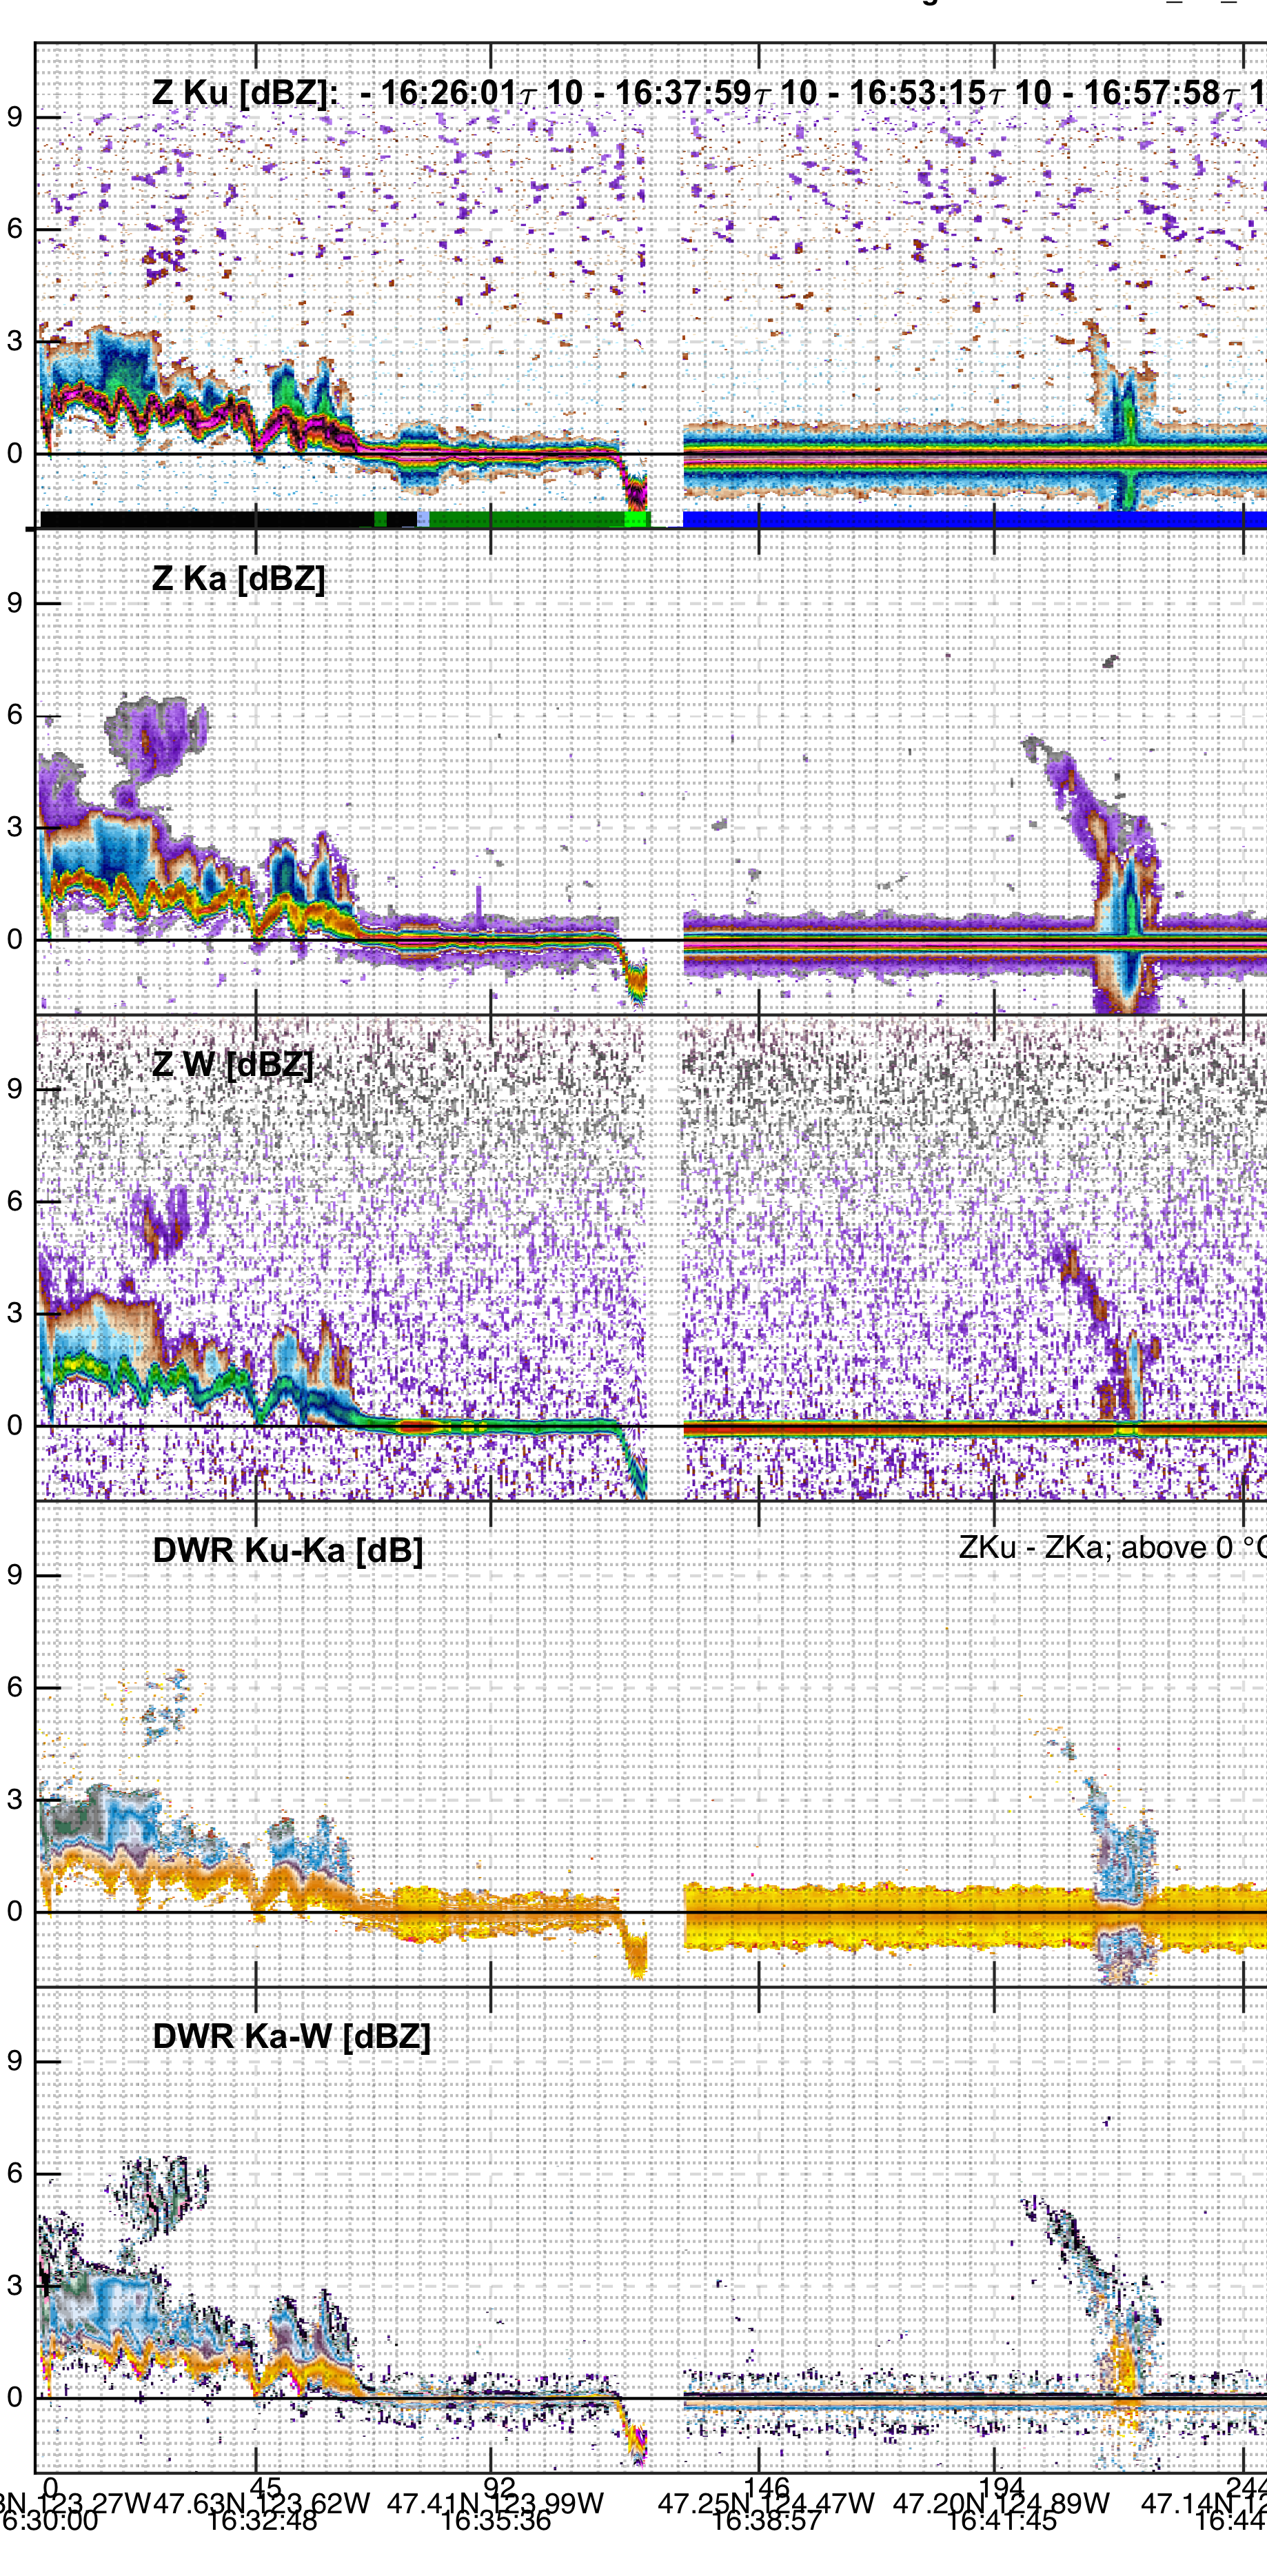
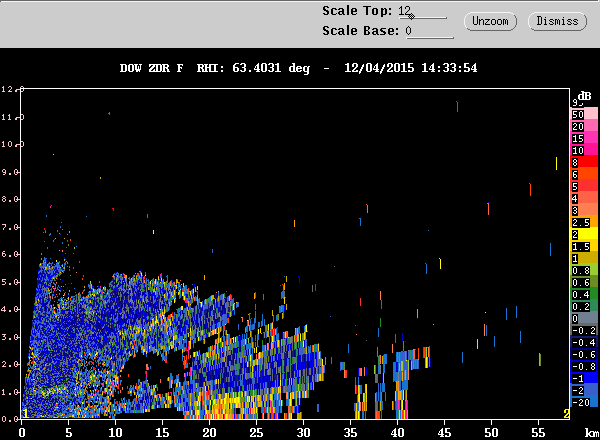
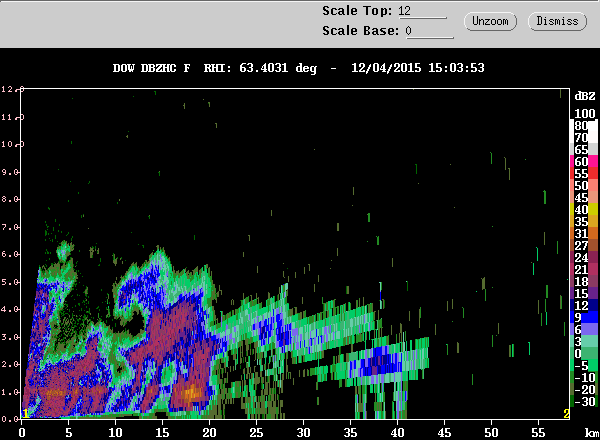
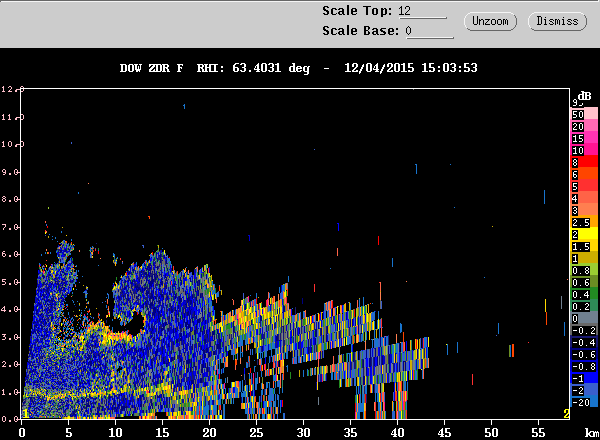
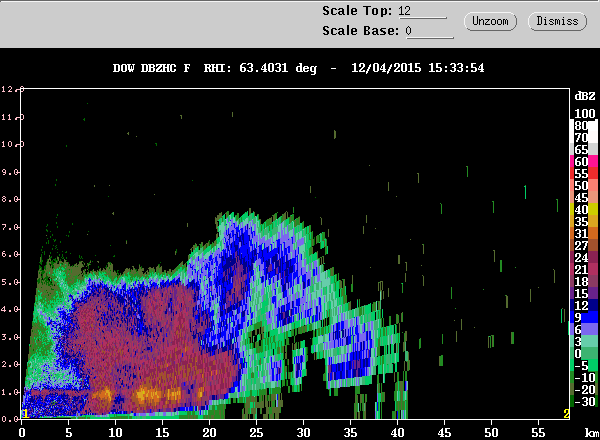
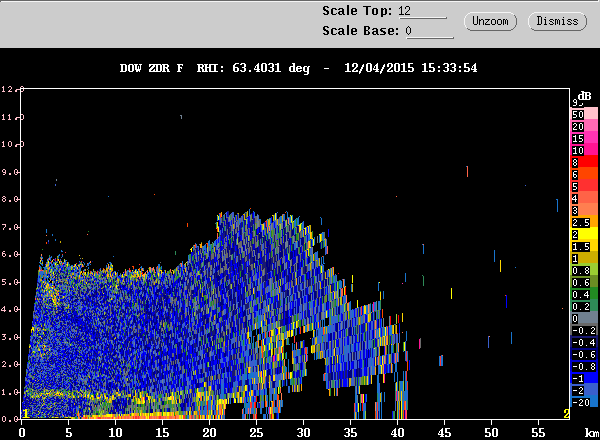
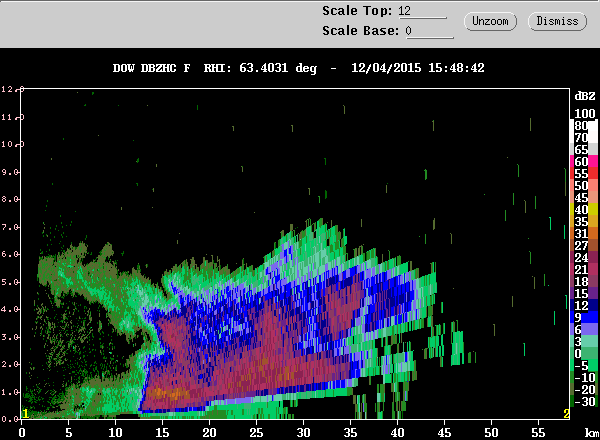
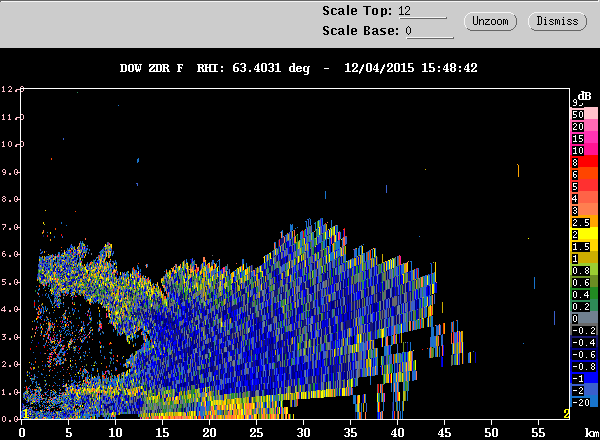
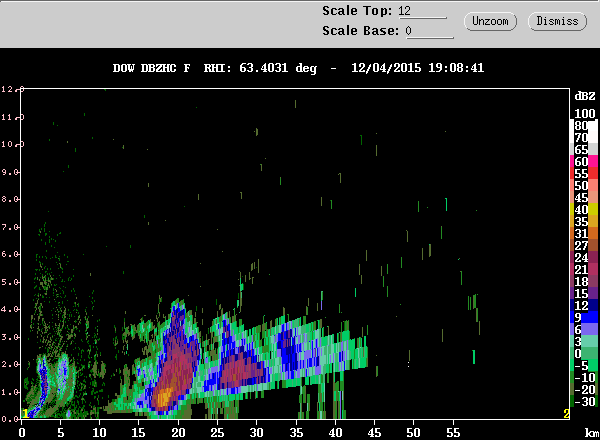
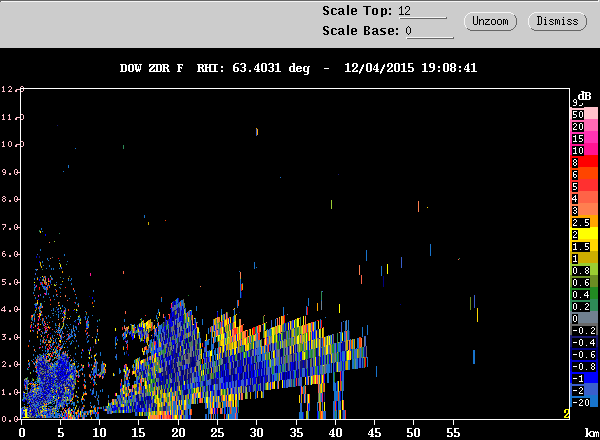
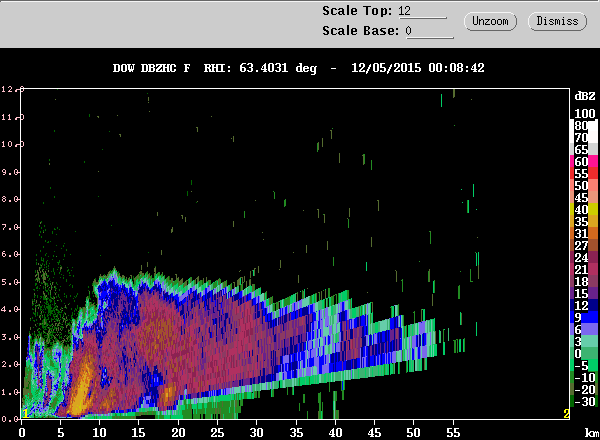
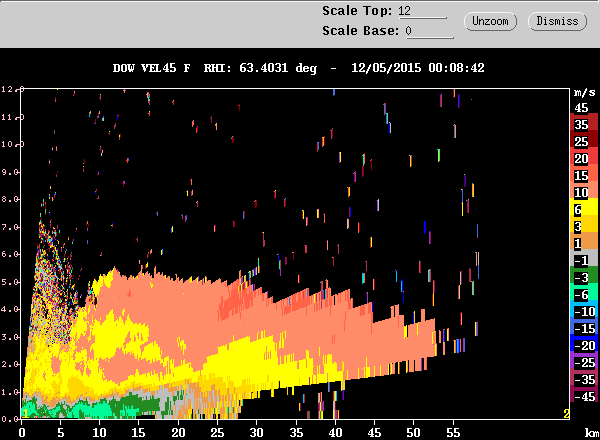
Figure 9 shows the progression
of post-frontal convective activity over the Quinault
Valley as seen by the DOW radar. Much of the time the
convection seen by the DOW was patchy and less than ~ 5
km in height (first two rows of Figure
9). When the rainband seen earlier over the ocean
passed over the DOW sector, it had a stratiform
appearance, with the bright band tilting down over the
sloping terrain in response to orographic lifting (third
row of Figure 9). From 1500 UTC
onward, convective cells continued to form in the DOW
sector. Mostly, they were small and shallow but
moderately intense (rows four, five and six of Figure 9). In the last few hours
of 4 December and the first 2-3 hours of 5 December,
relatively strong graupel and rain showers occurred,
continually regenerating in the lower valley and
advecting up-valley producing a layer of snow over the
terrain (row seven of Figure 9).
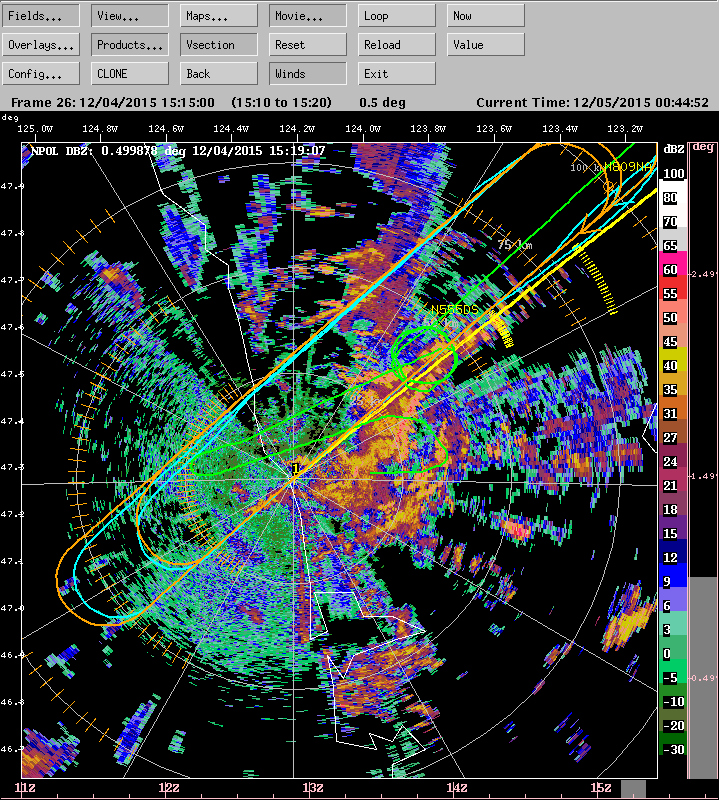
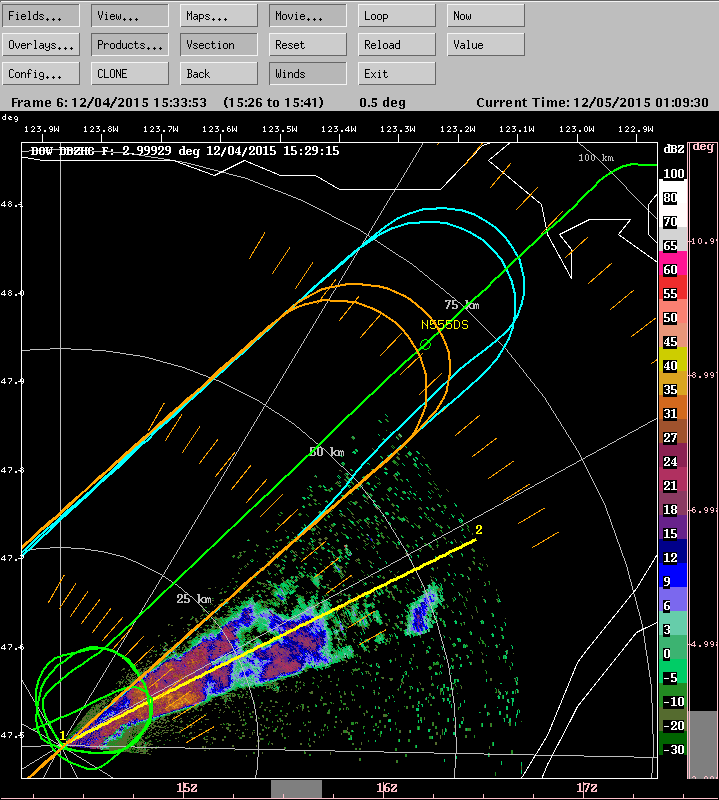
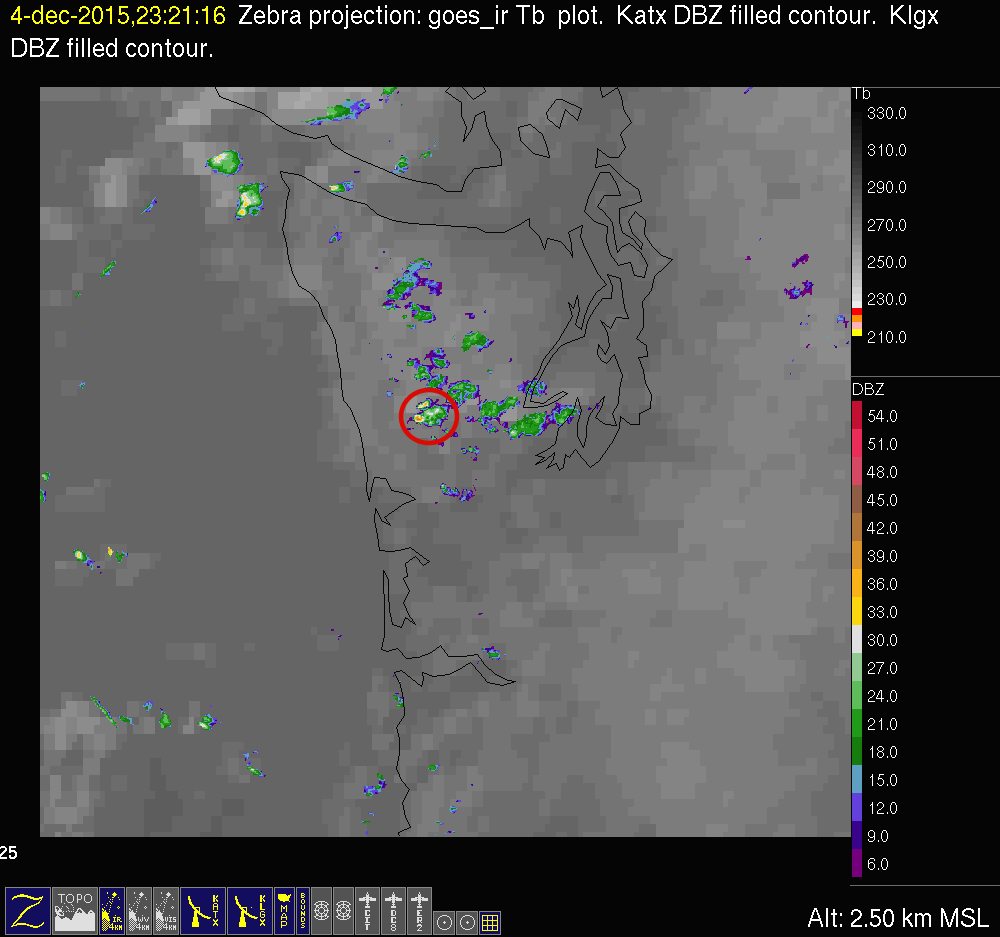
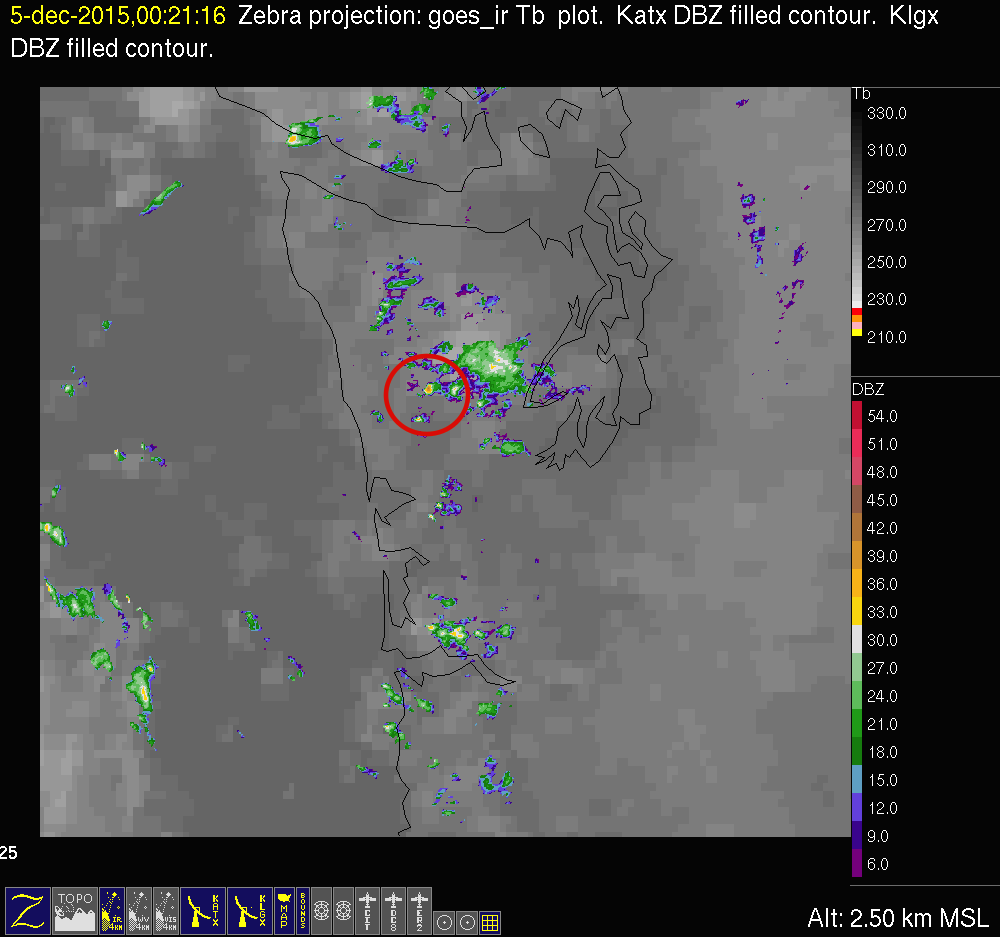
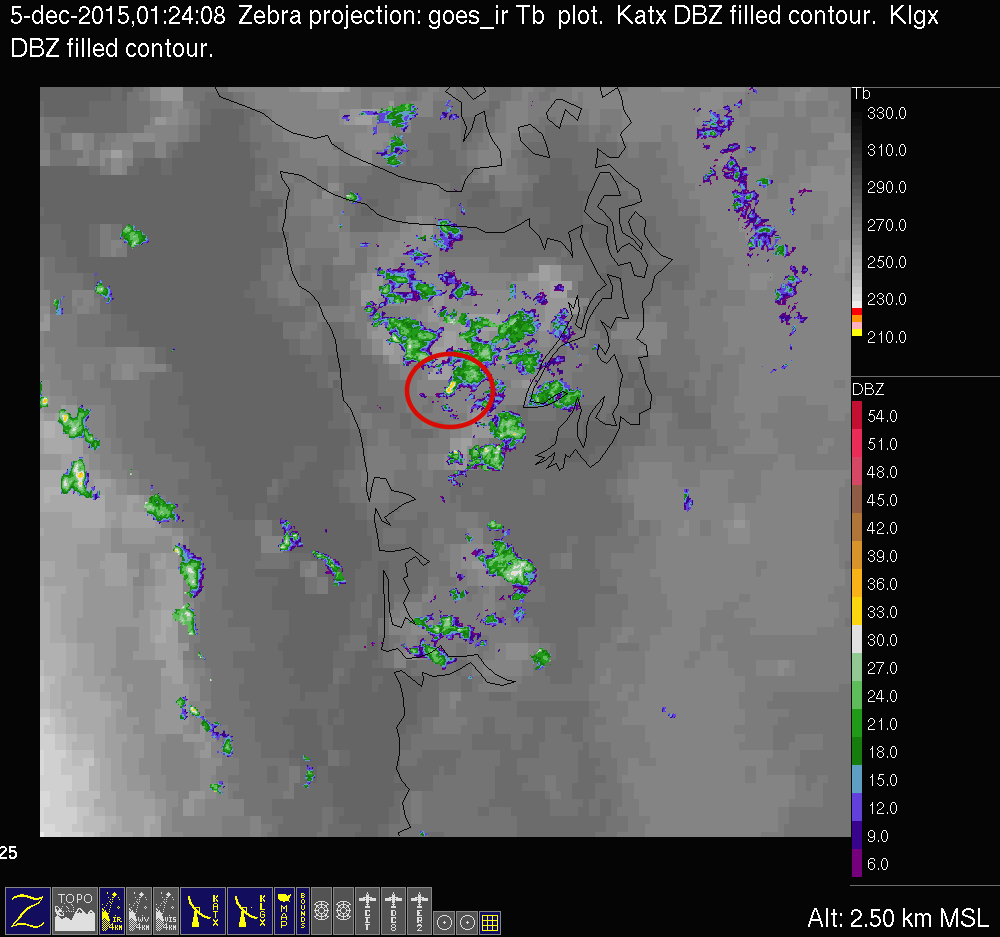
The post-frontal convection over the mountains at this
time could be seen in the NEXRAD/satellite overlay (Figure 10). Noted by red
circles are the most intense convective cells, which
were in the general vicinity of the Quinault Valley and
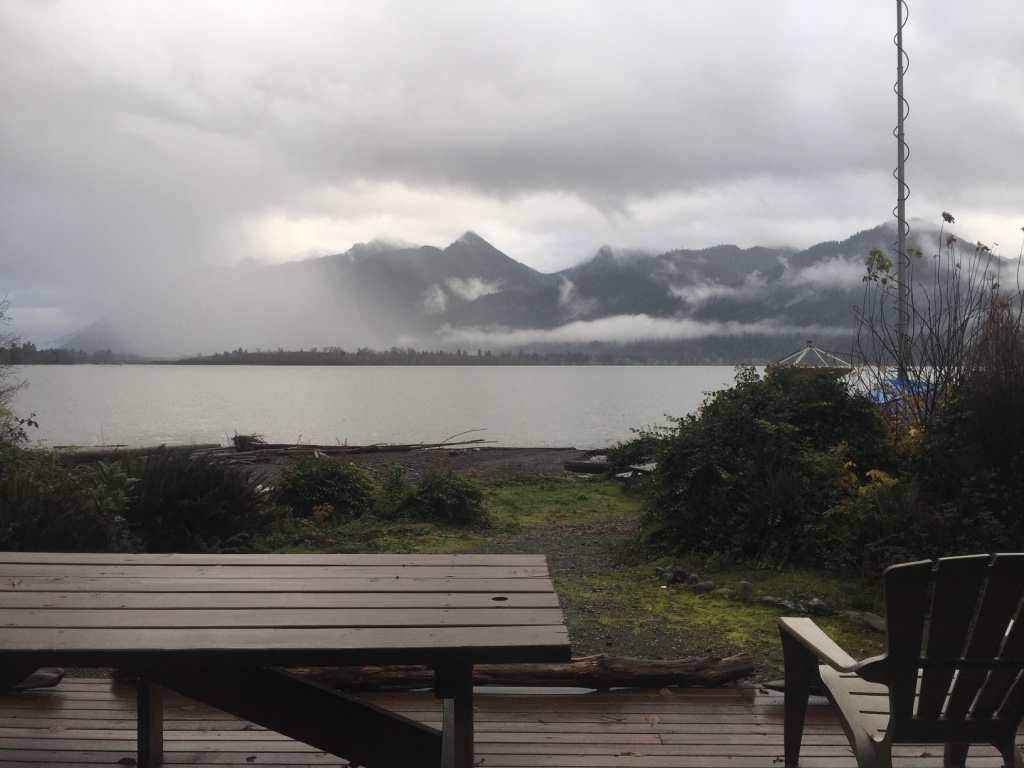
DOW radar. Figure 11 is a
photo taken at the DOW of one of the showers during this
period. Duting this time, there was strong down-valley
flow at low levels overridden by cross-barrier flow
above (Figure 12). A video
taken by Aaron Funk at the DOW site illustrates the
shear with low clouds moving down-valley and other cloud
traveling up-valley. The video also shows the water
flowing down-valley and a graupel shower.
|