This storm
was a classic Pacific Northwest frontal system. It was
sampled by a GPM/GMI overpass and by all of the
OLYMPEX aircraft, radars, and ground sites. The
aircraft sampled and extensive stratiform
precipitation area in the earlier phase of the storm
and the beginning of a shear-induced Kelvin-Helmholtz
wave outbreak in the central part of the storm. After
the aircraft flights, the NPOL and DOW radars documented
the continuation and maturation of the KH wave outbreak
and the very brief post-frontal phase that overlapped
the pre-frontal phase of the next baroclinic system.
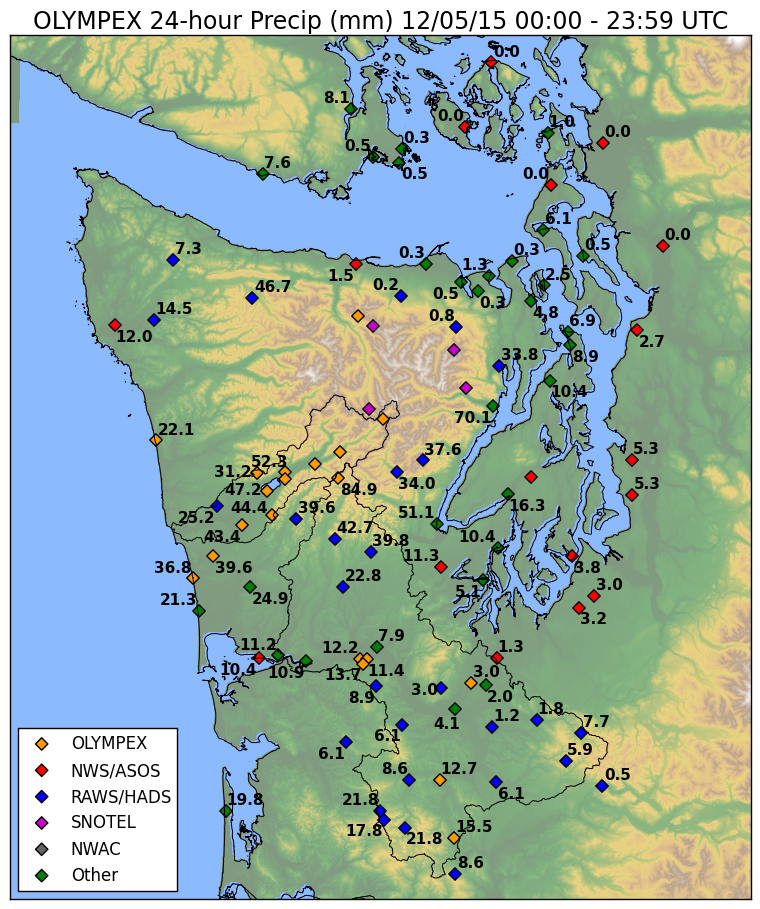
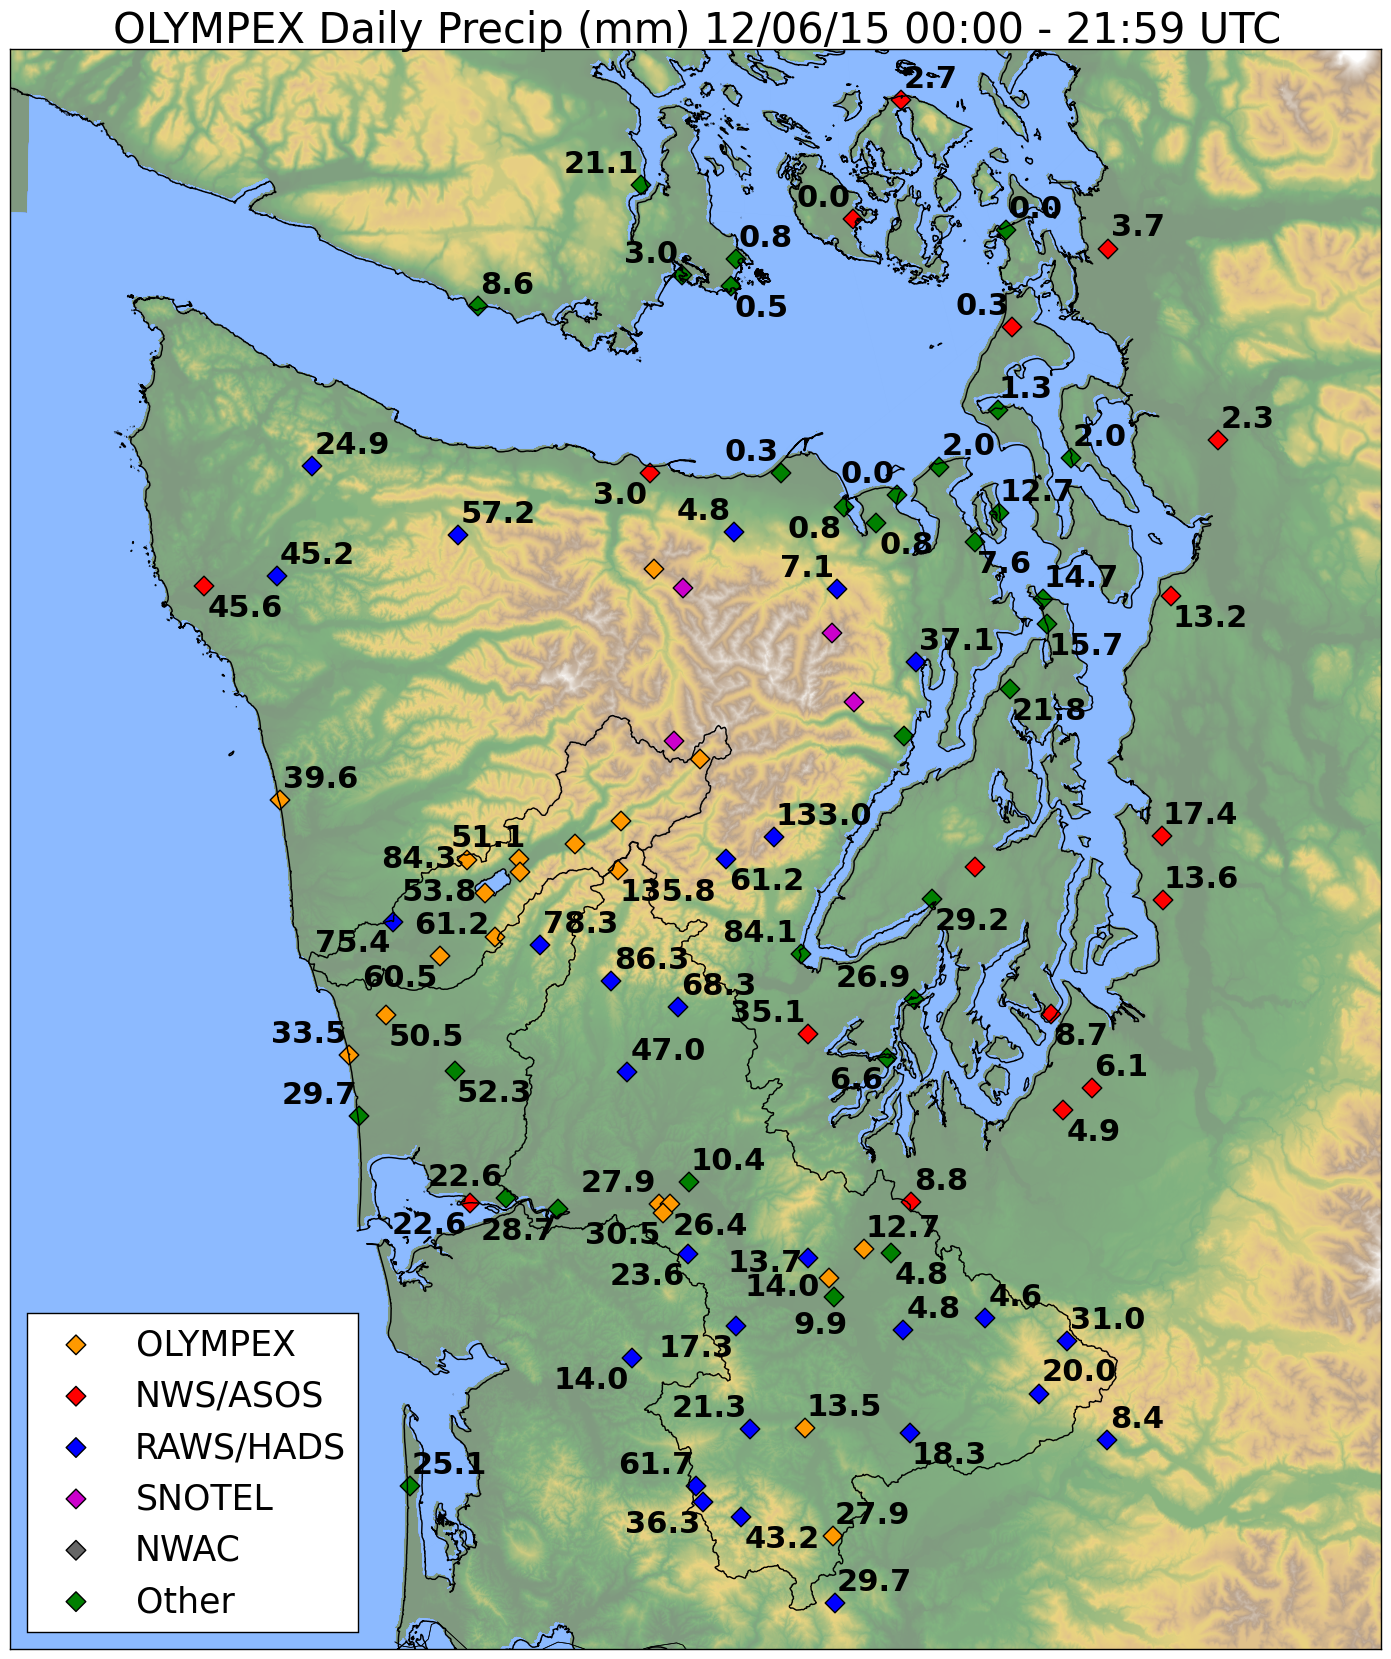
The precipitation was divided between the UTC 24 h
periods of the 5th and 6th of December. As can be seen
from the precipitation maps in Figure
1, the two-day totals were ~100 mm through out
the south and southwest Olympic Mountains, including
the Quinault Valley. Over 200 mm occurred at some
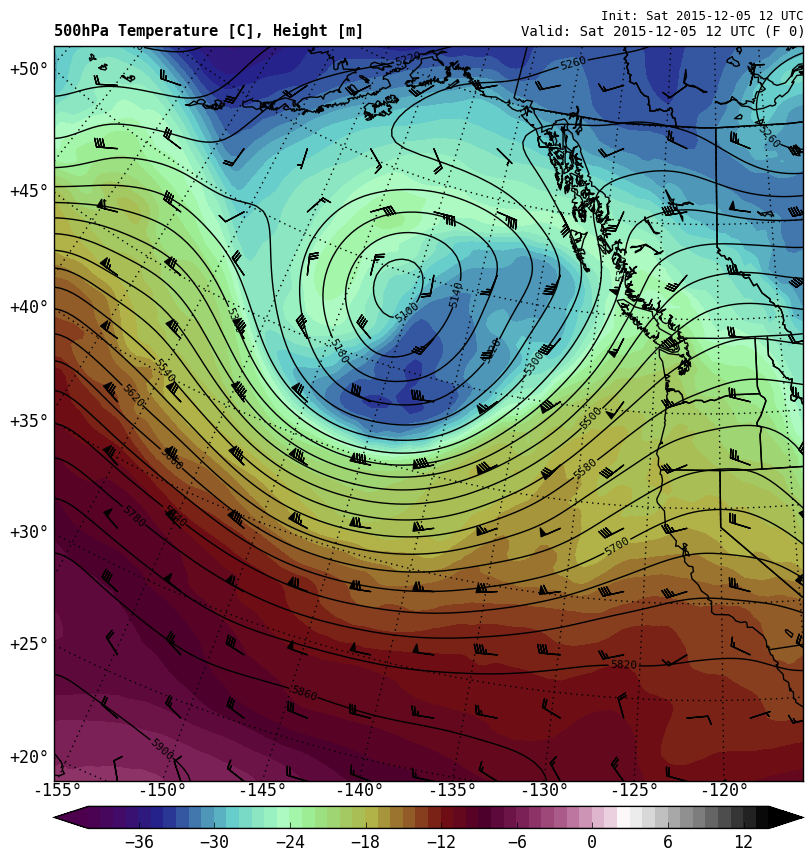
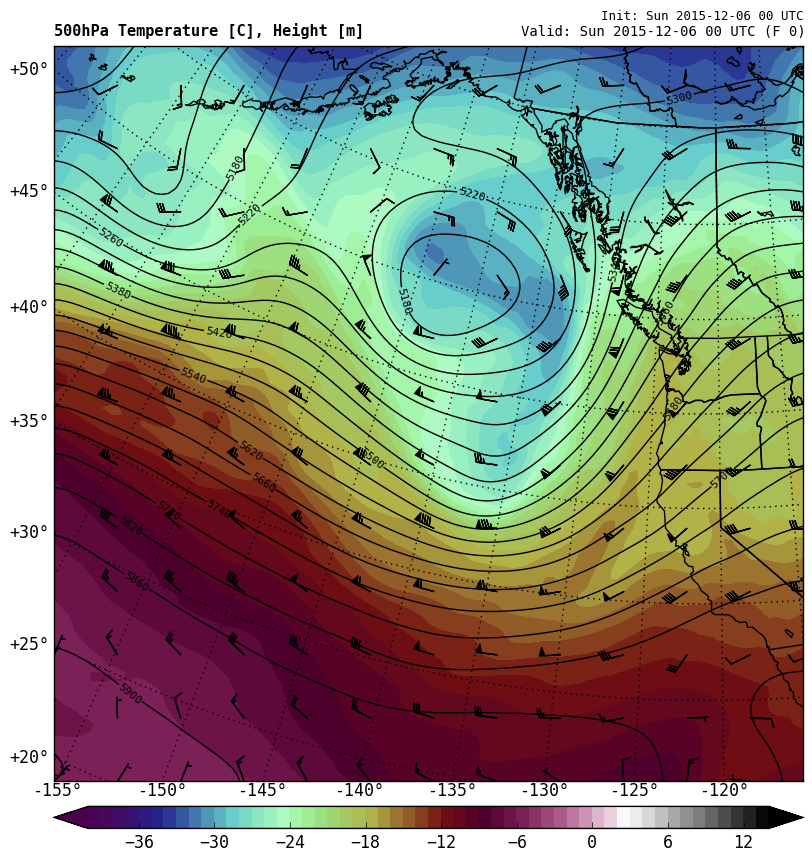
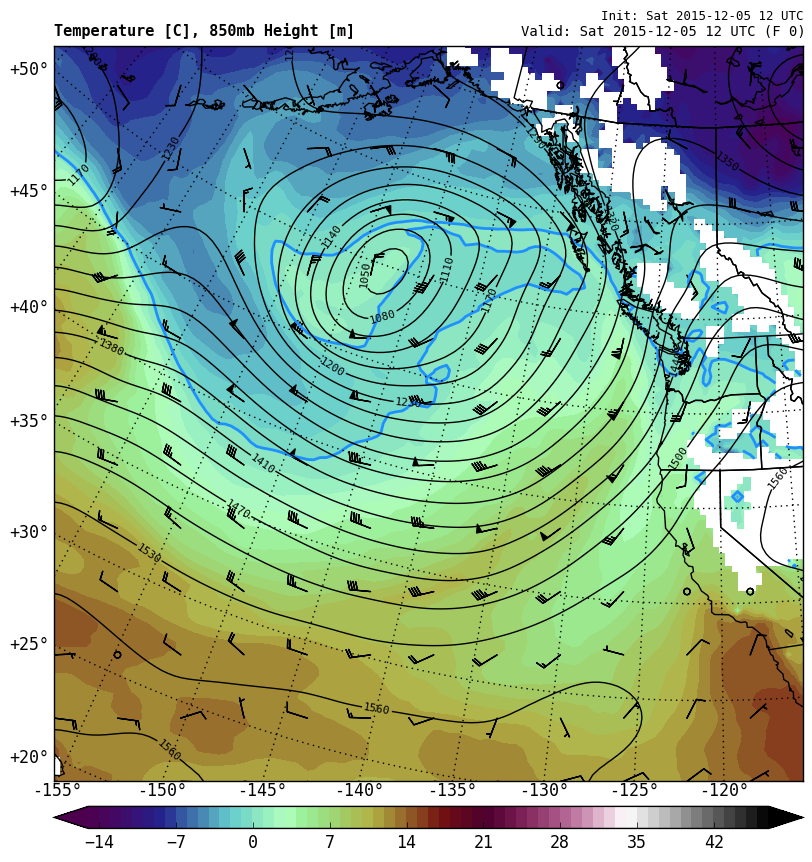
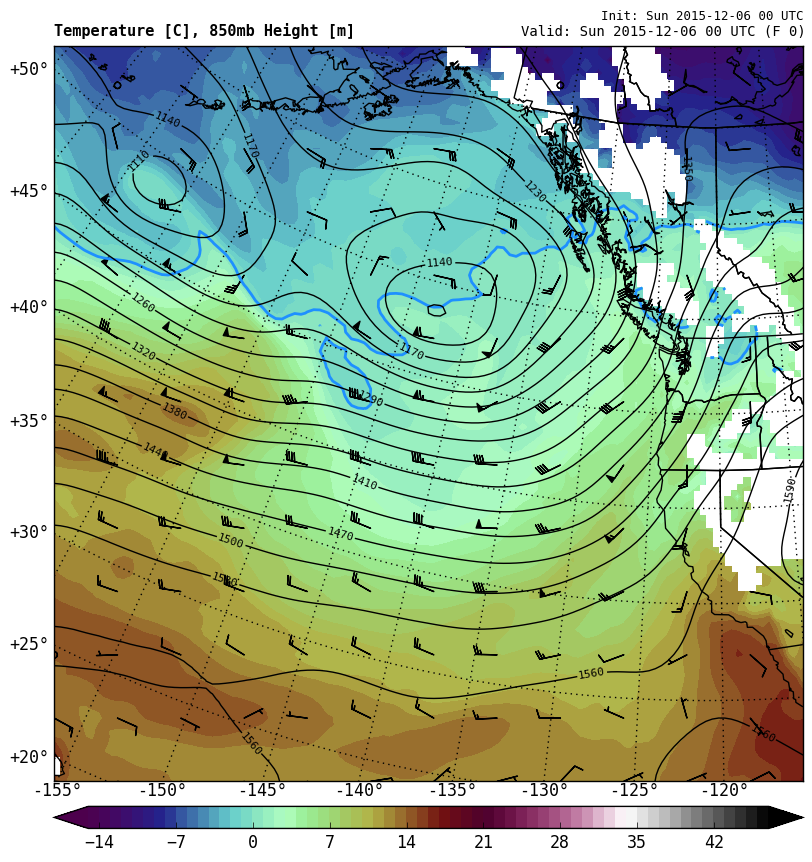
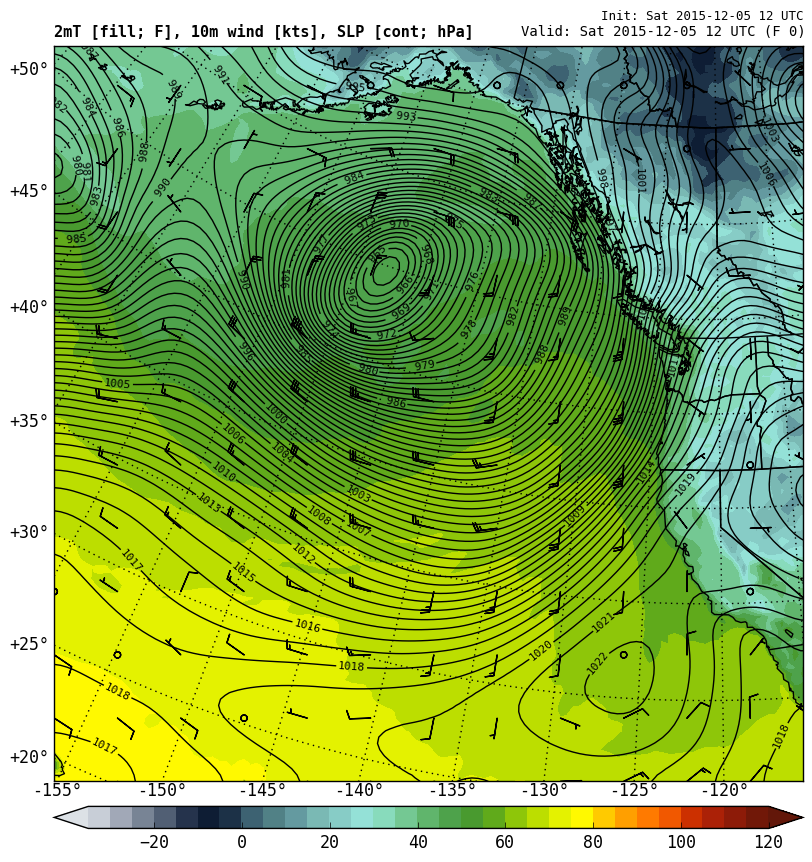
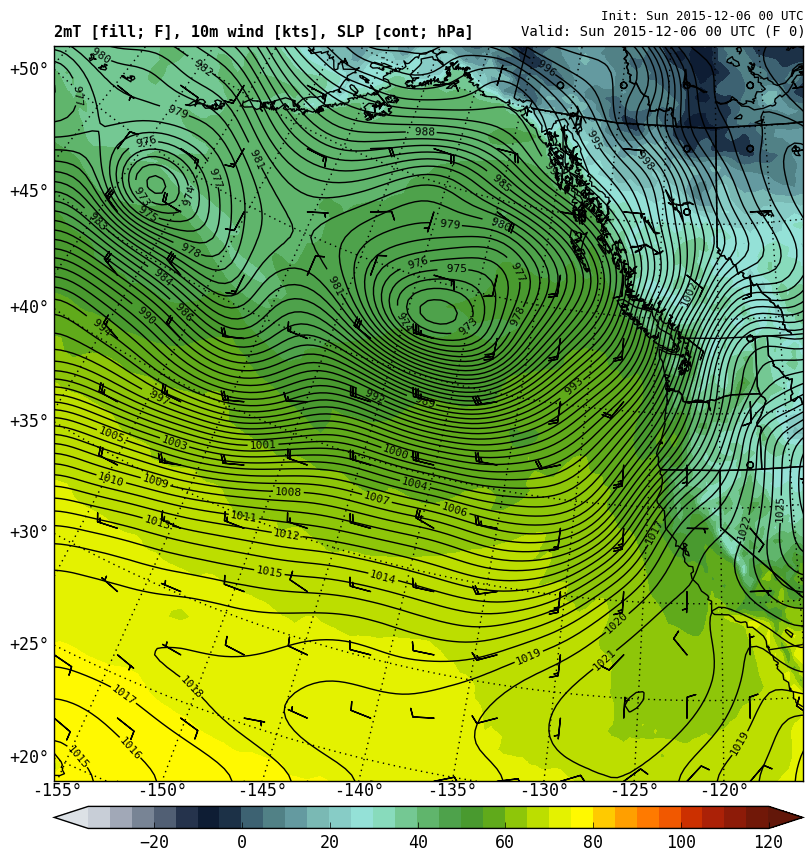
sites just to the south of the Quinault region. Figure 2 shows the trough moving
over the area during the period of the satellite
overpass and flights. Conditions at upper levels were
cool enough that a significant portion of the
precipitation at higher elevations was snow. An
important feature of the storm was strong winds at
both the 850 and 500 hPa levels. The surface maps in
the lower panels of Figure 2
indicate an occluded frontal structure albeit with
very weak temperature gradients. Surface
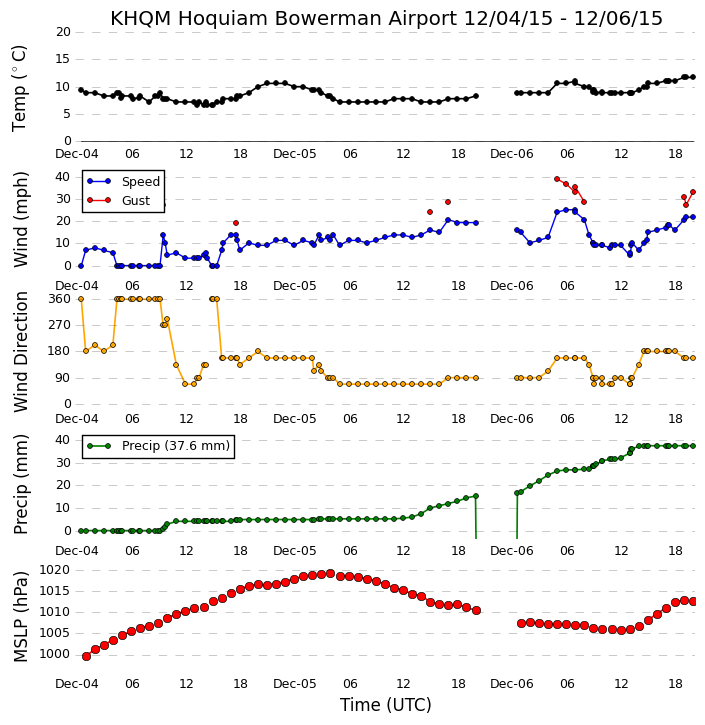
meteorological observations show the passage of a
broad trough at about 1200-1300 UTC 6 December with
little temperature change and only gradual wind shift
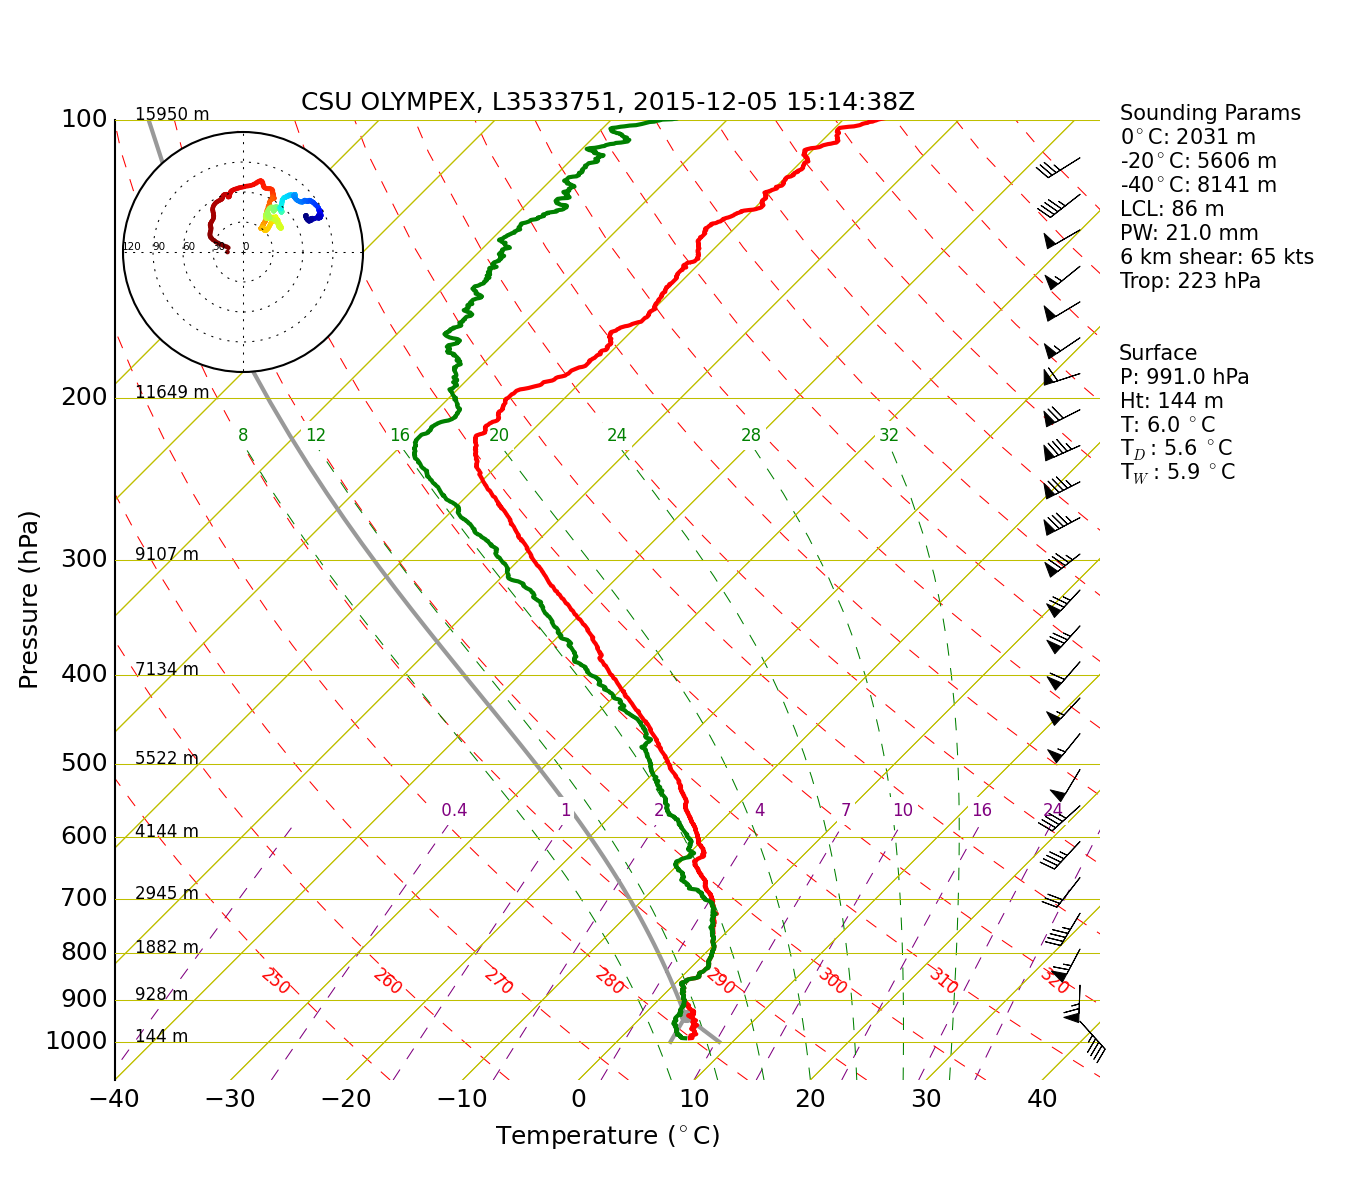
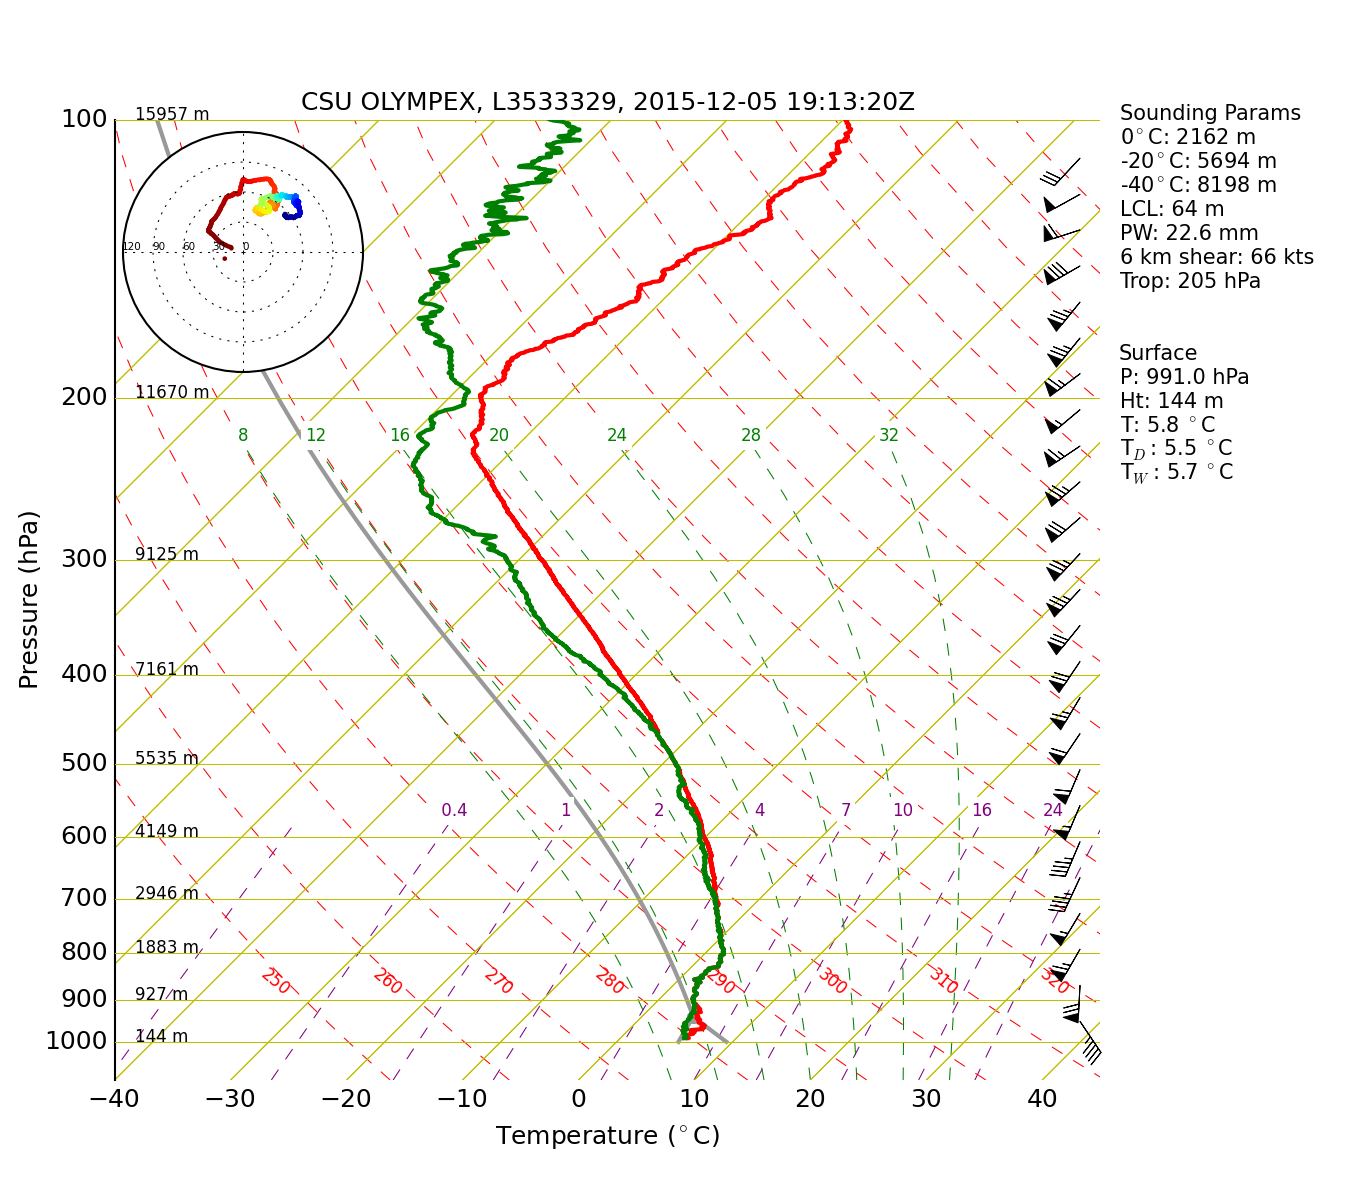
(Figure 3). Figure 4 shows that the
soundings at 1500 and 1900 UTC 5 December at the NPOL
site (during the time of the aircraft operations and
satellite overpass) were indicating very strong
southwesterly winds at levels 900 hPa and higher. At
the surface the winds were moderate and southeasterly
at these times. The strong shear at low levels had
profound effects on the radar echoes at NPOL and DOW,
as will be shown below. The period of strong winds and
shear were also captured by the profiler at Forks (see
Figure 5) between 1400 UTC 5
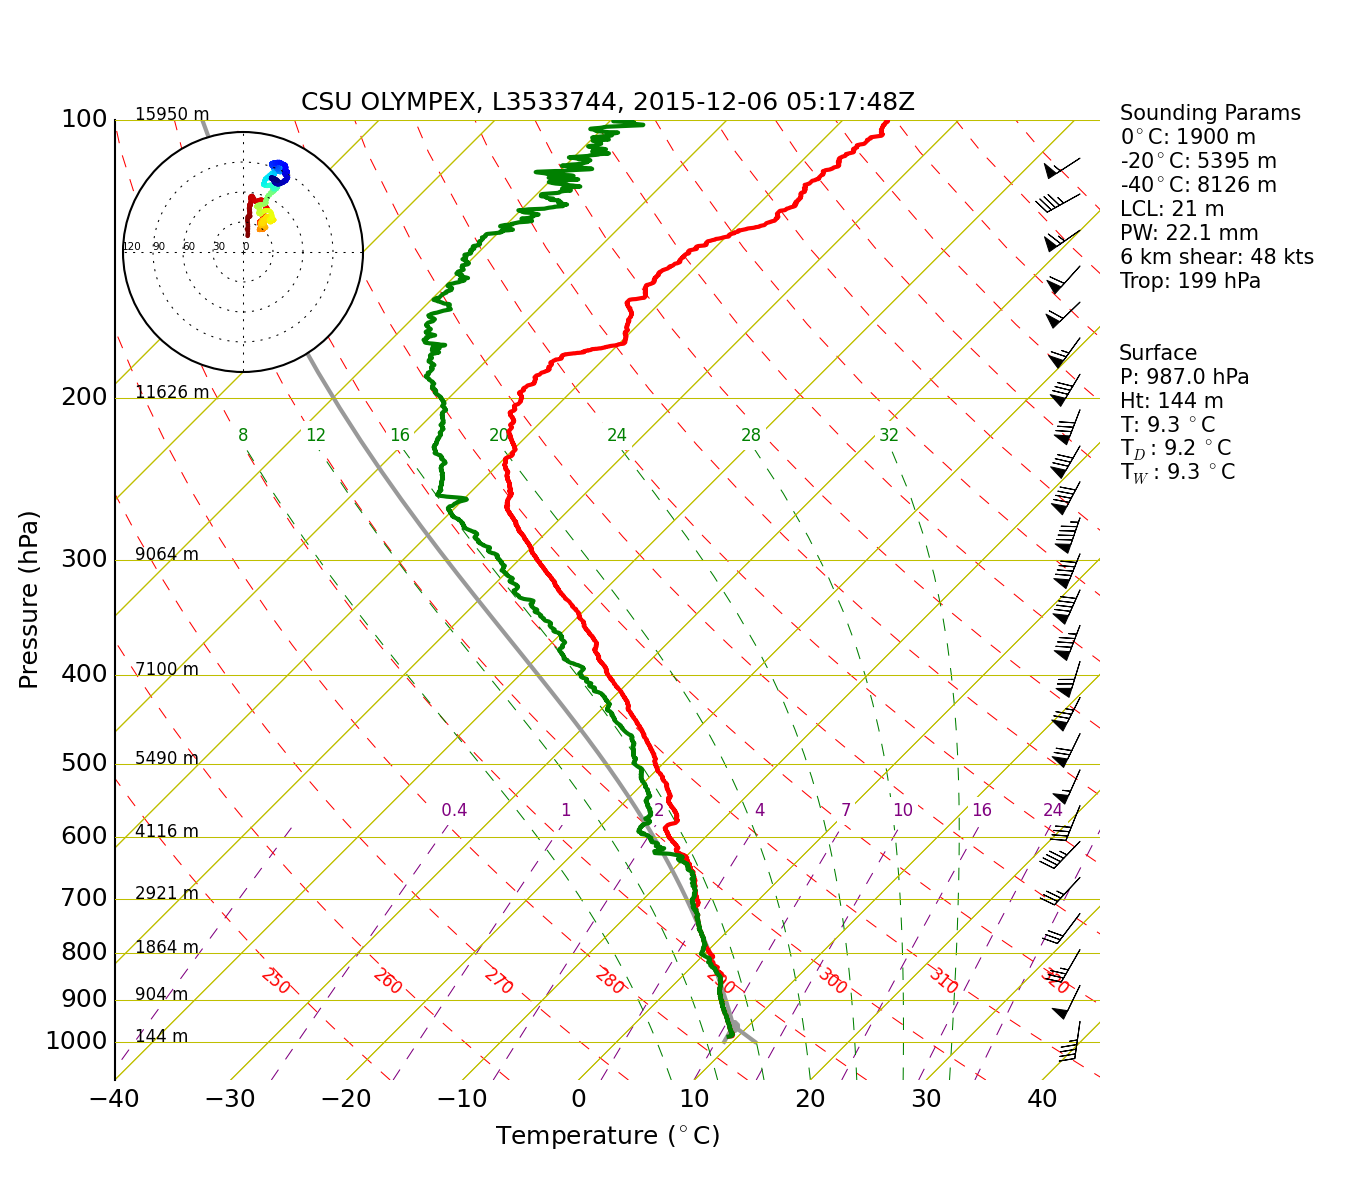
December and 0200 UTC 6 December. By 0500 UTC 6
December the sounding in the right panel of Figure 4 and the profiler data
in Figure 5 show that the
winds aloft had weakened and the surface wind had
become south-southwesterly even though the trough had
not yet passed. The fall velocities in Figure 5 further show that the
0°C level began lowering before the trough passage at
the surface.
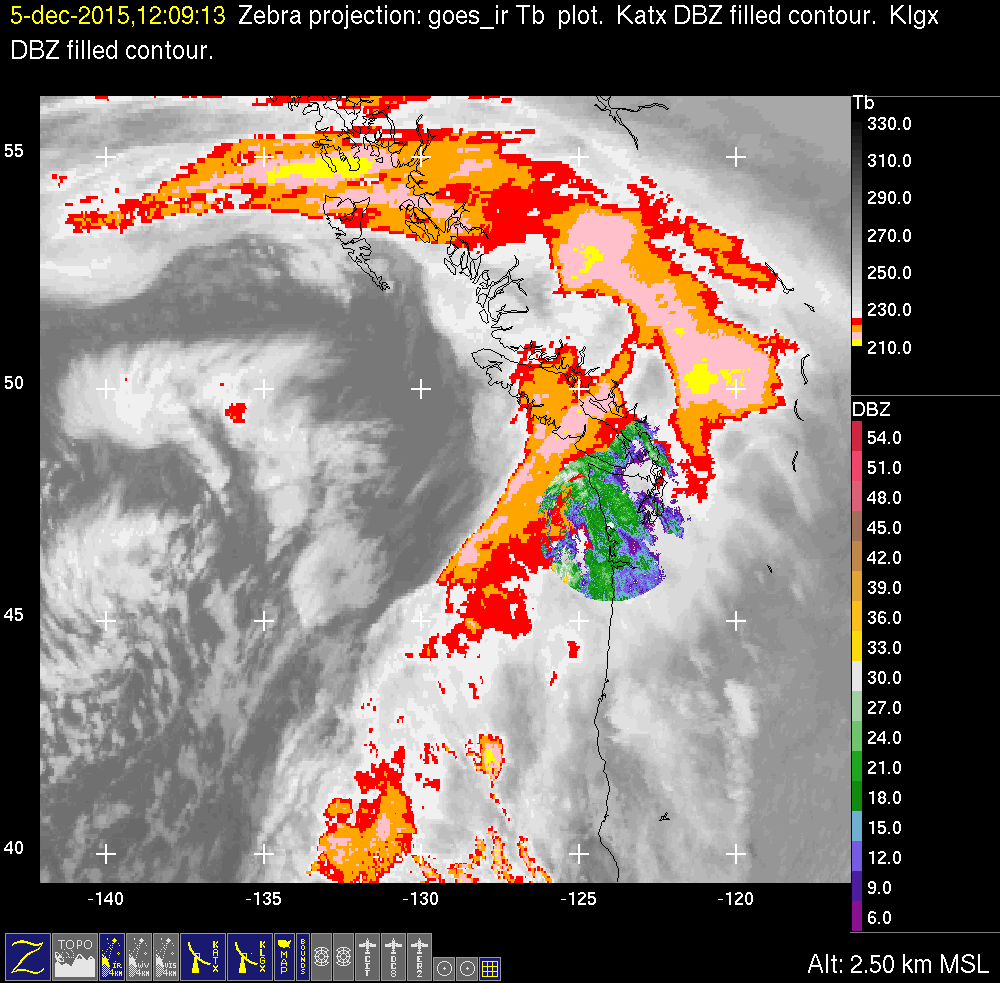
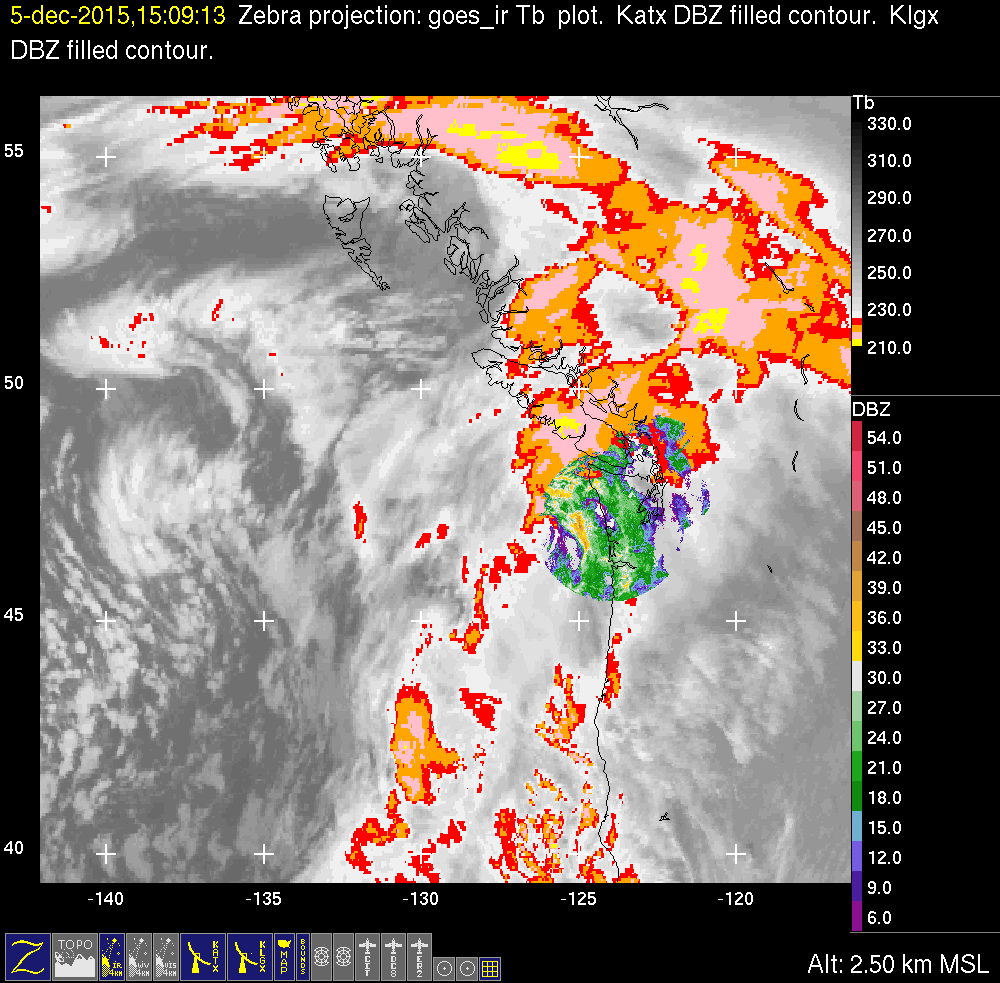
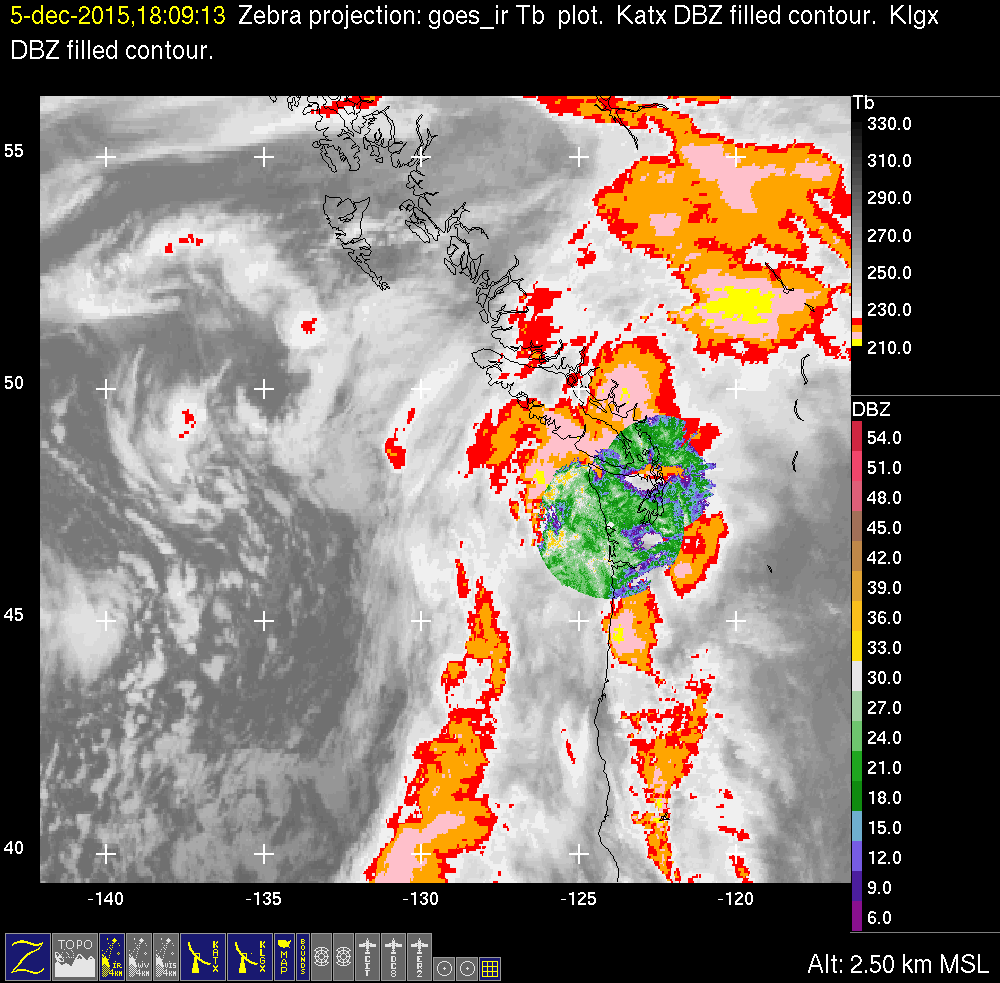
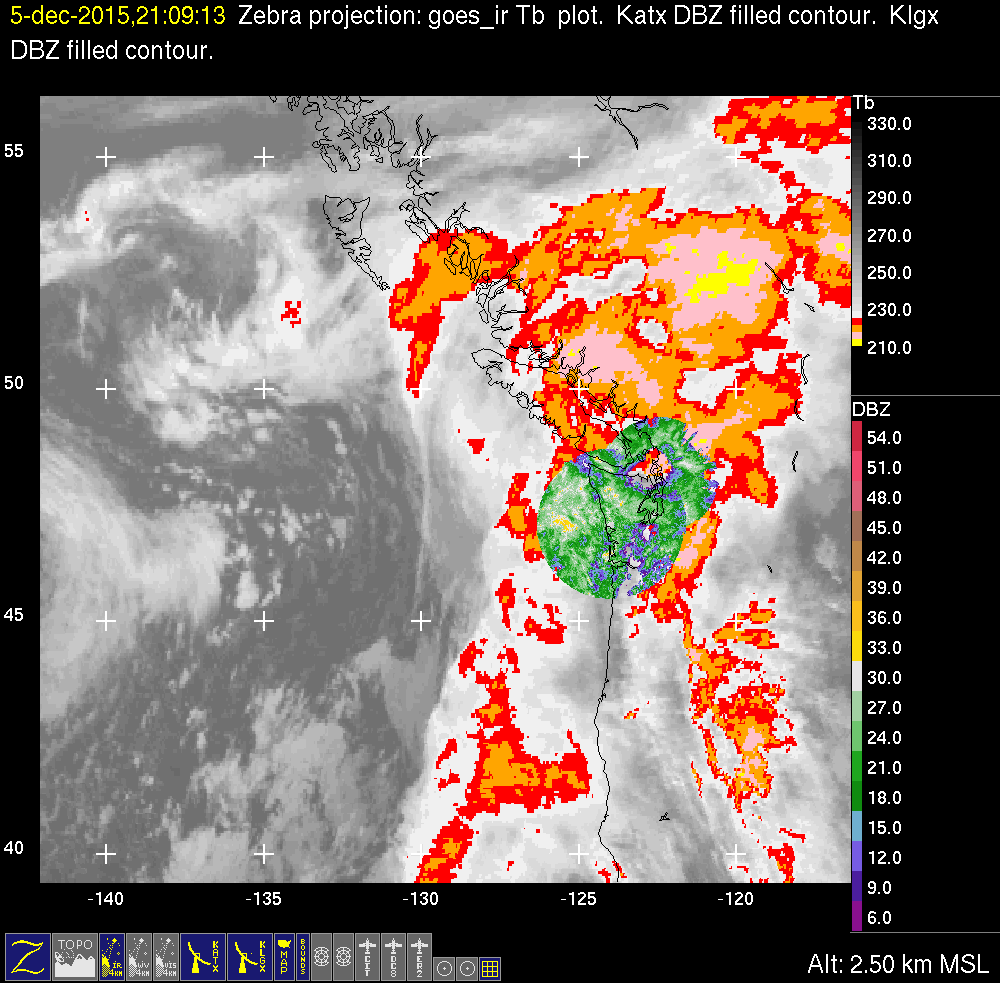
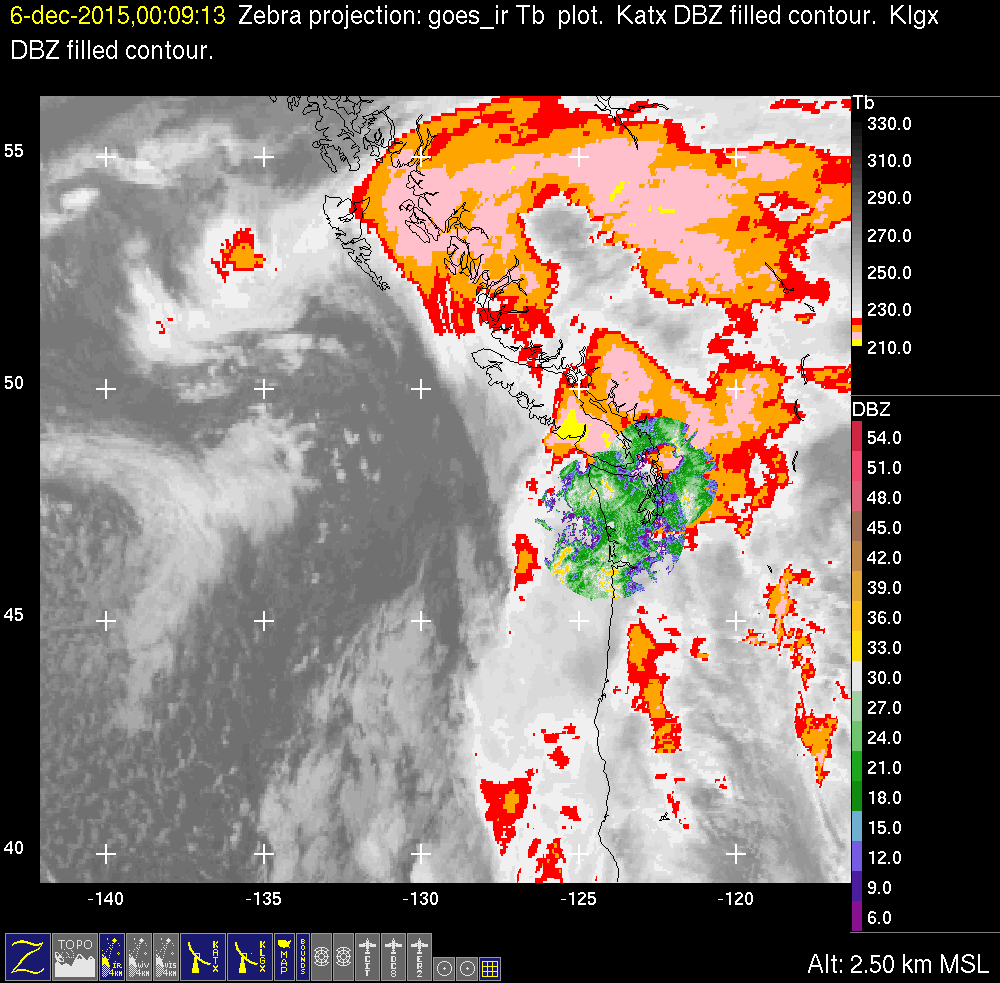
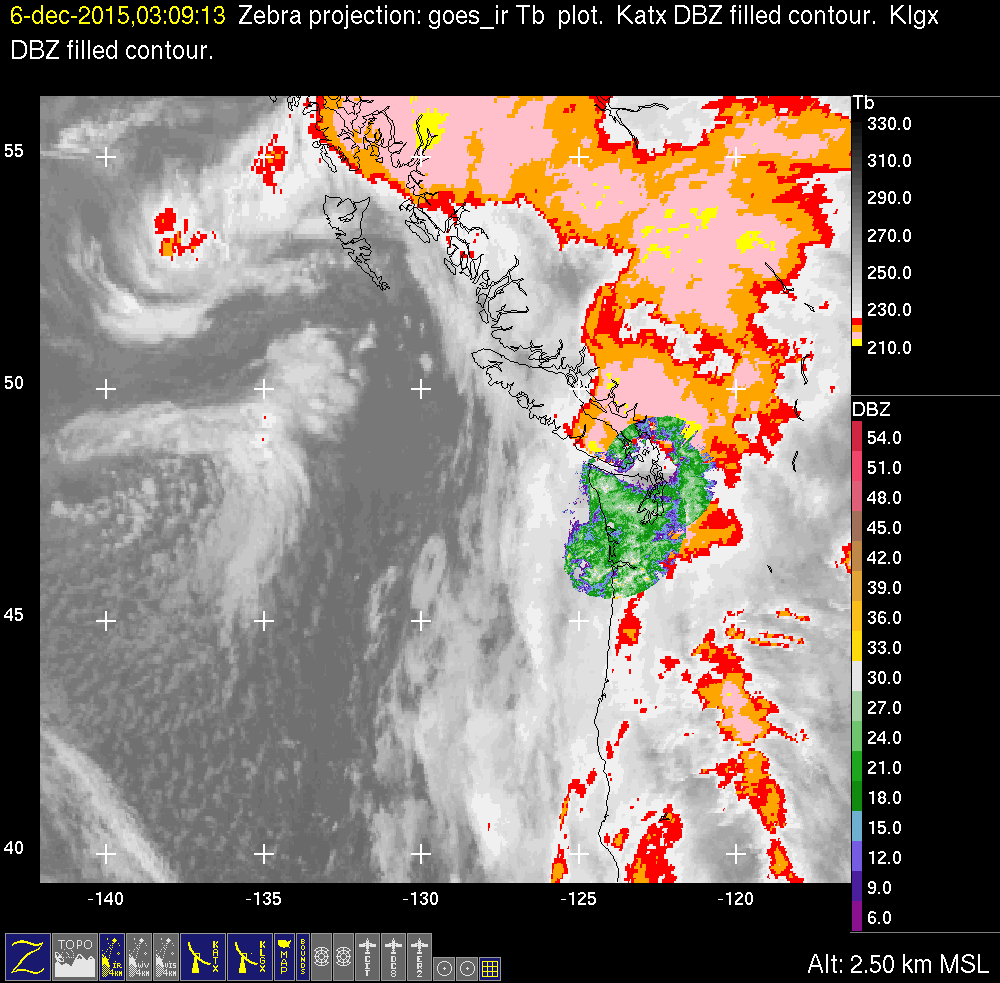
The satellite/radar overlays in Figure
6 show the progression of the cloud and
precipitation pattern across the OLYMPEX region. The
top row of images show the cloud pattern in the time
period bracketing the GPM overpass and aircraft
flight. Note that the storm continued to move across
the region for many hours after that time, and the
OLYMPEX radars continued to document extremely
important phenomena over the land after the time of
the flights. The sequence of images in Figure 7 show that the
three aircraft flew coordinated missions in the heart
of the precipitation both over the ocean and over land
throughout the time period of the satellite overpass.
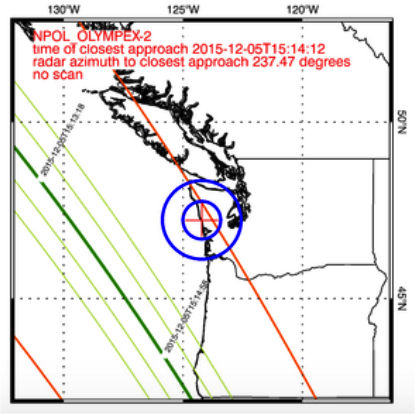
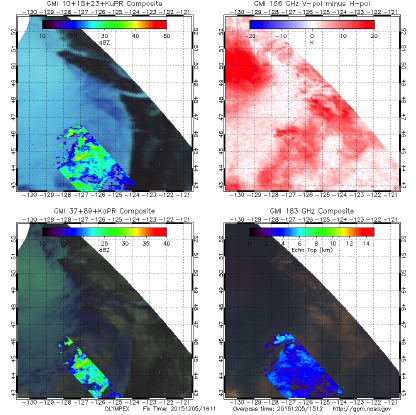
The left panel of Figure 8 shows
the location of the GPM overpass. It was ideally
located for evaluation of the GMI passive microwave
sensors on the satellite. The GMI images obtained by
the satellite on the overpass are in the right panel
of Figure 8. The CPL lidar aboard
the ER2 aircraft (Figure 9) shows
the cloud top to have been near 11 km throughout the
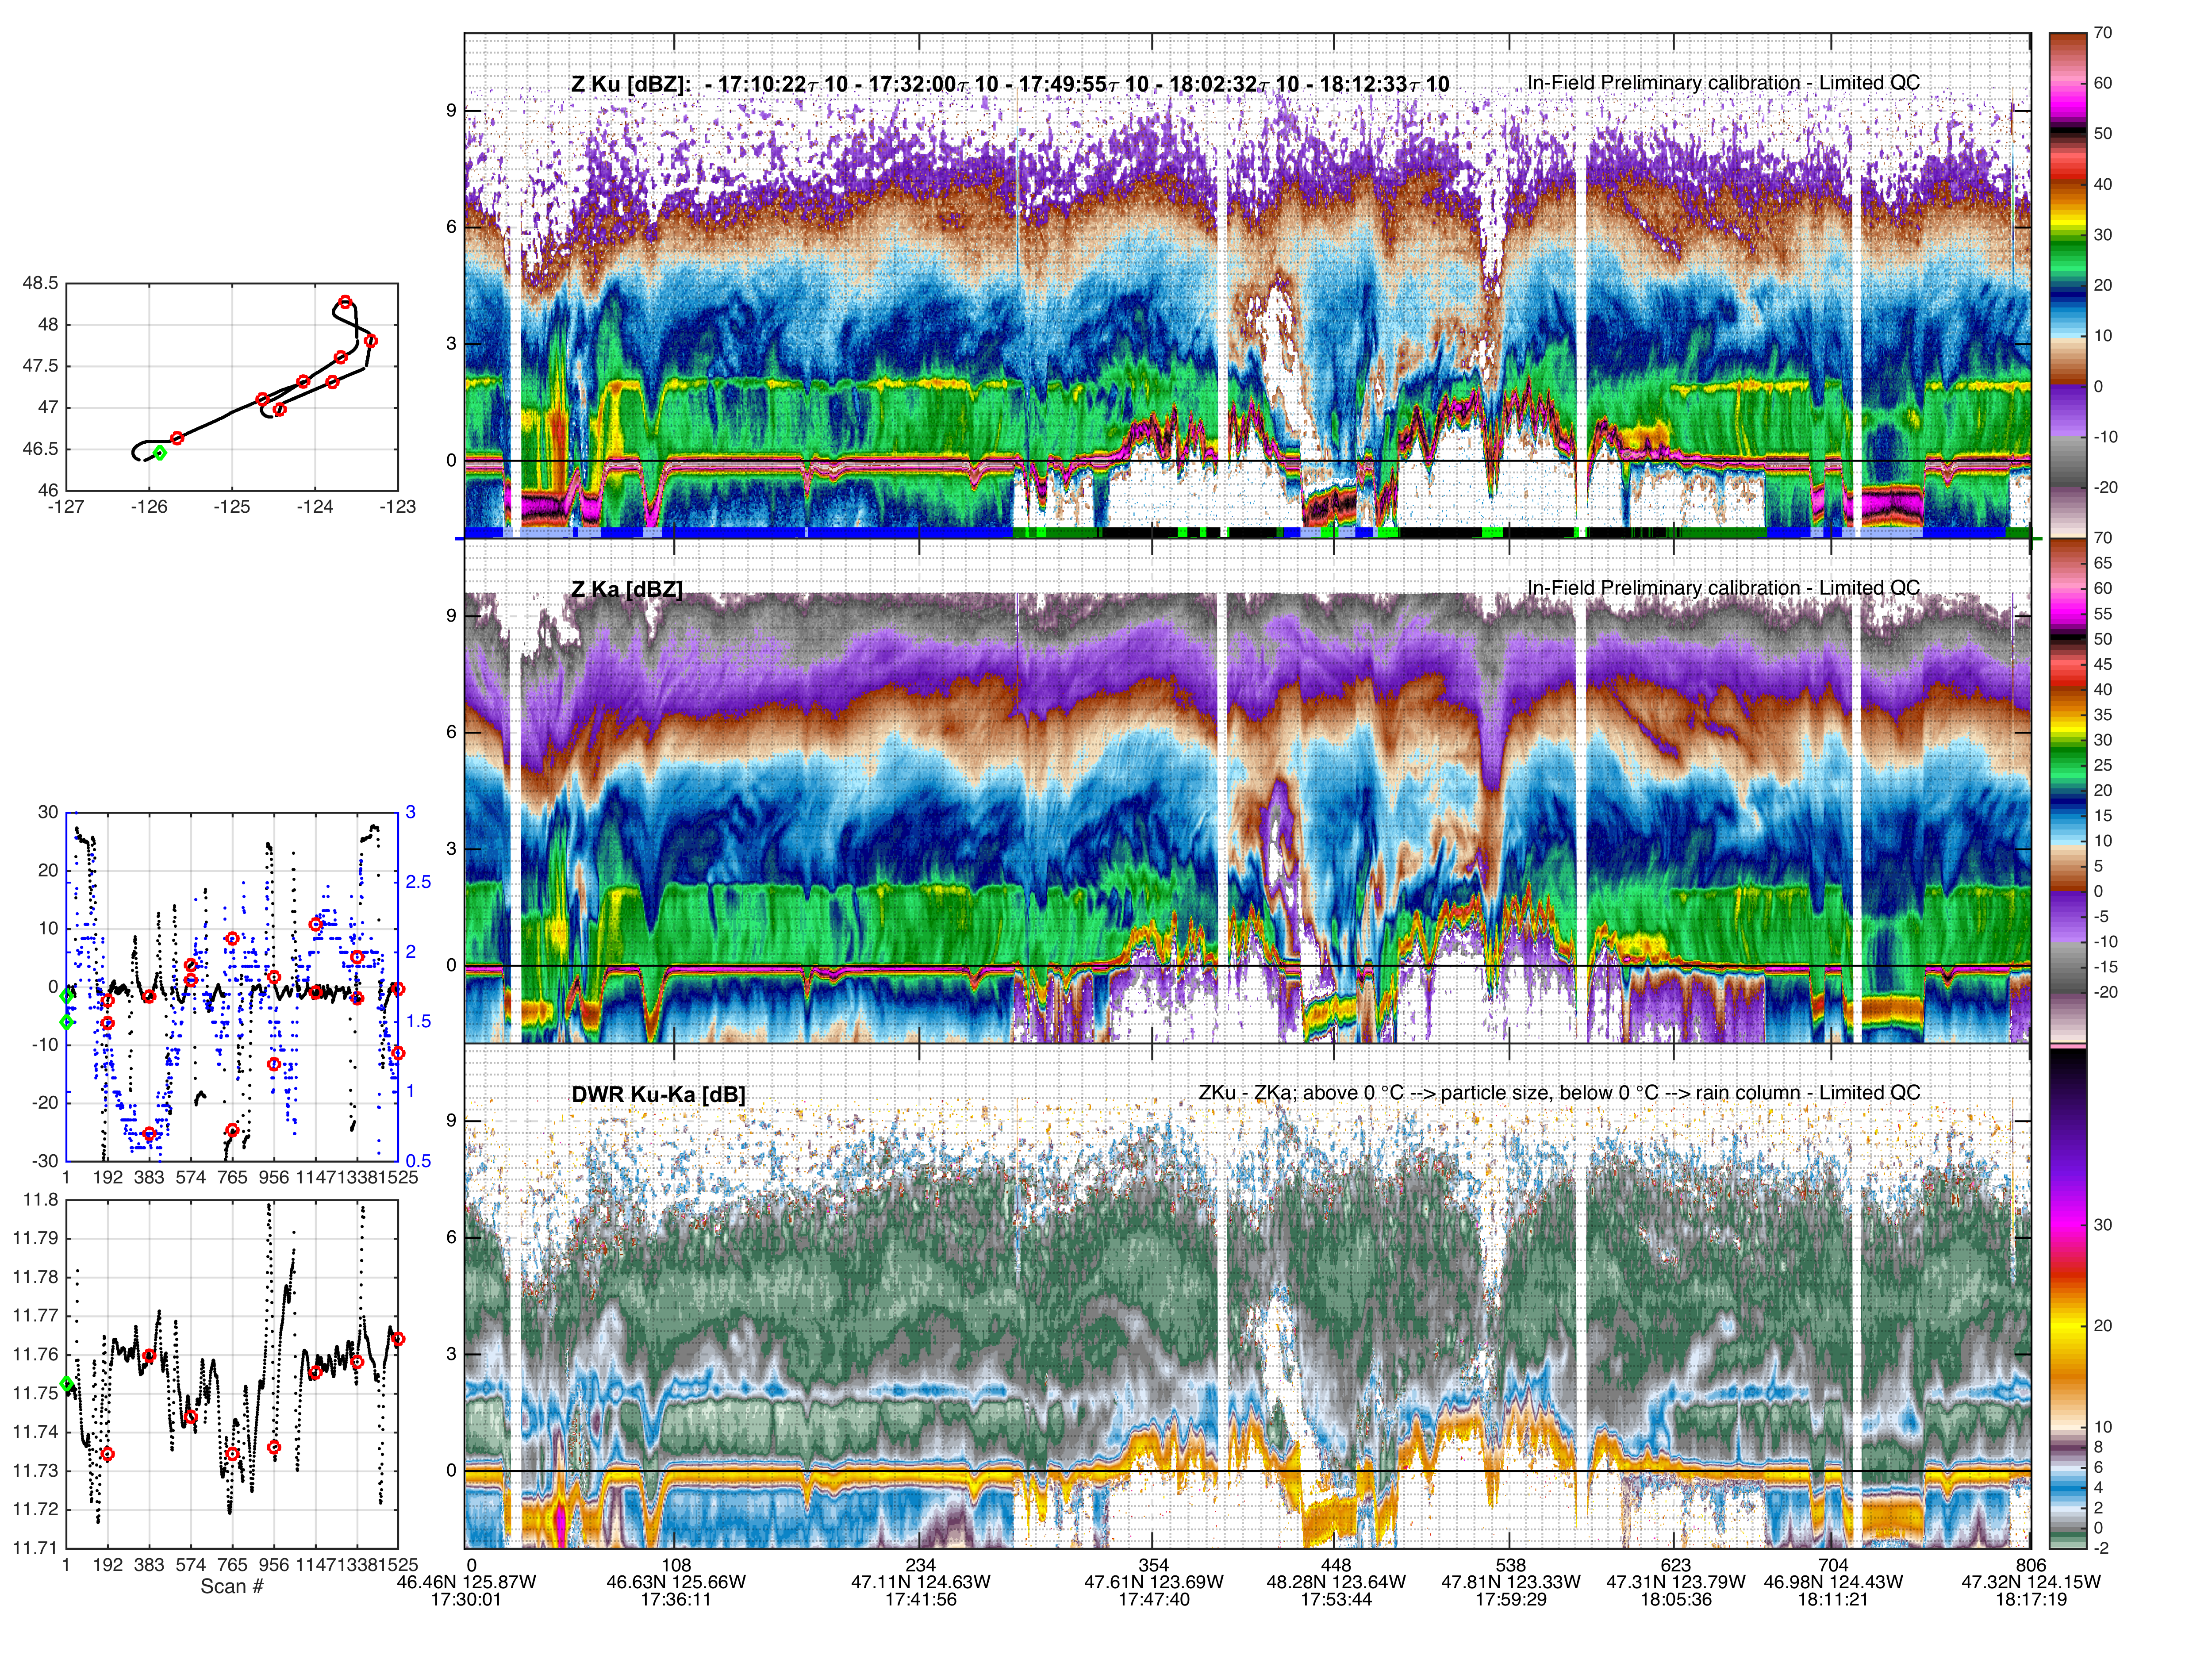
region of the flights. The APR2 radar on the DC8 was
obtaining data throughout the flight. The example of
APR2 data in Figure 10 shows the
relatively uniform stratiform precipitation over the
ocean and a jagged echo pattern over the mountain
slopes. This jagged pattern may be related to the KH
wave activity seen on the NPOL and DOW radars, which
will be described below.
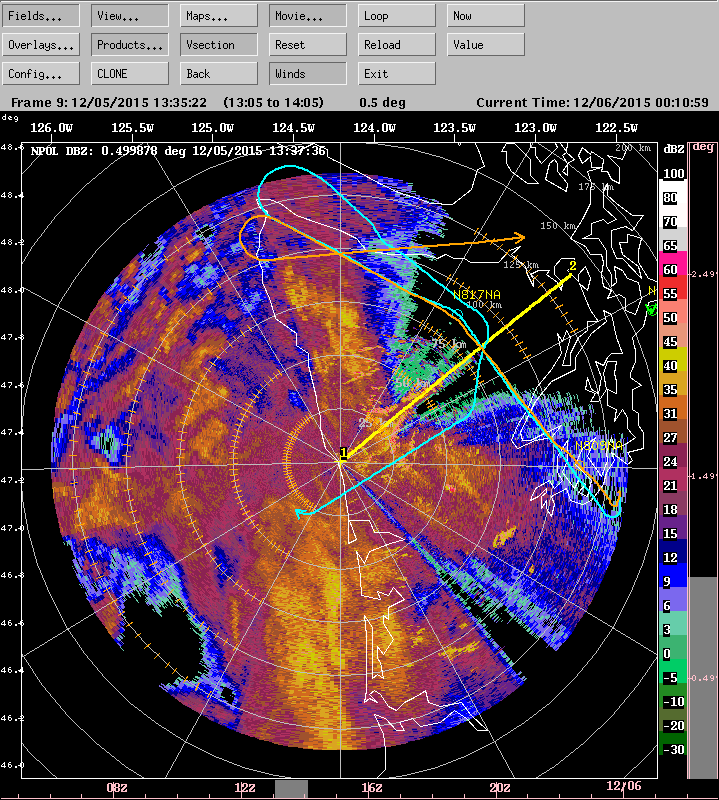
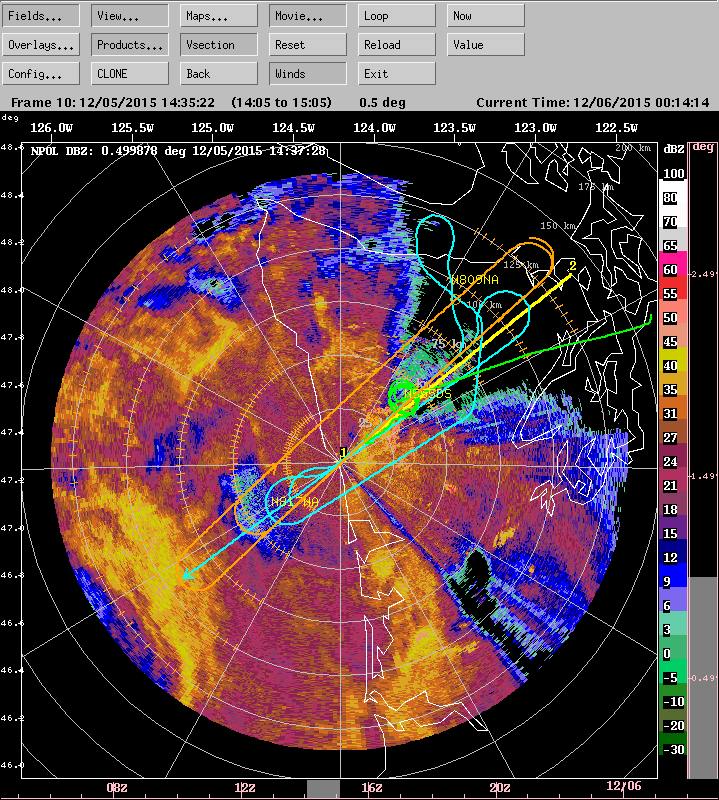
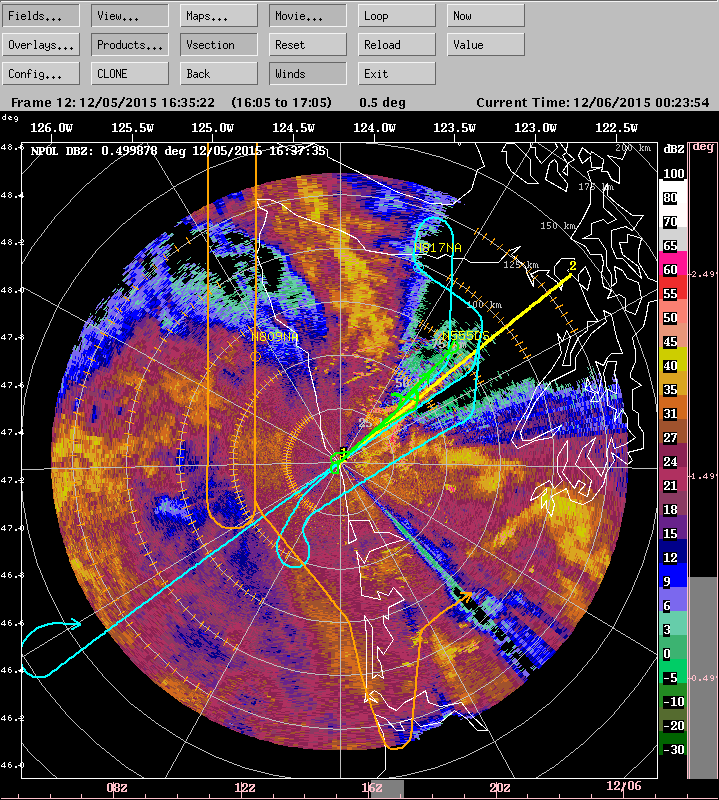
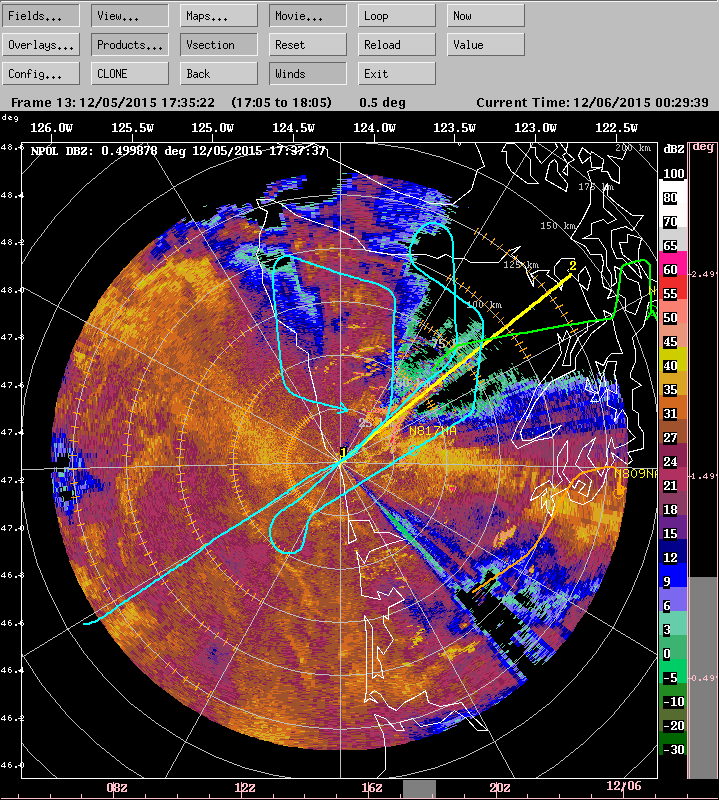
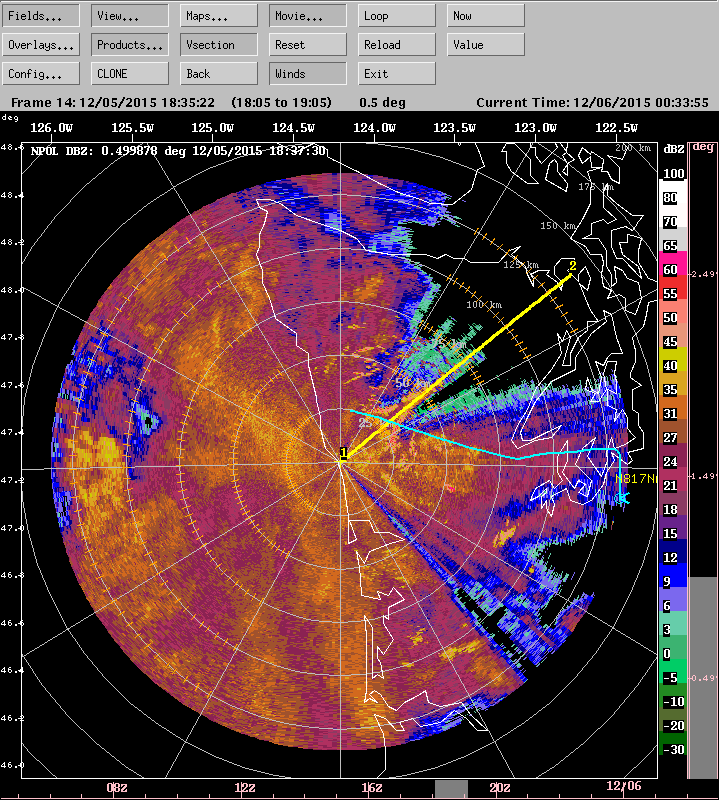
One of the most interesting observations in this storm
is the appearance of KH waves, which have been seen in
the central parts baroclinic cloud systems passing
over the Alps, Cascades, and Sierra Nevada range in
previous field program. This storm is their first
appearance in OLYMPEX; the shear described above was
apparently needed for the waves to manifest, as has
been previously hypothesized in those previous
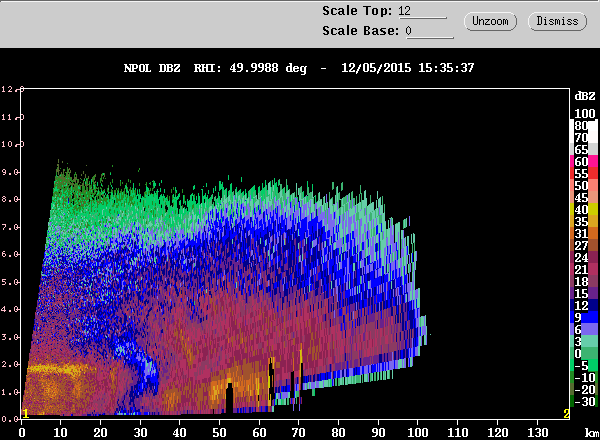
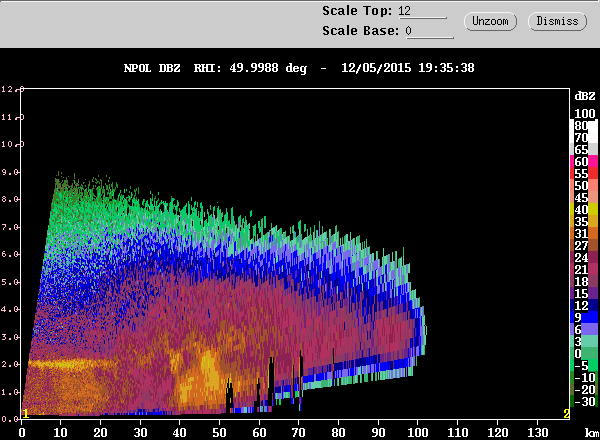
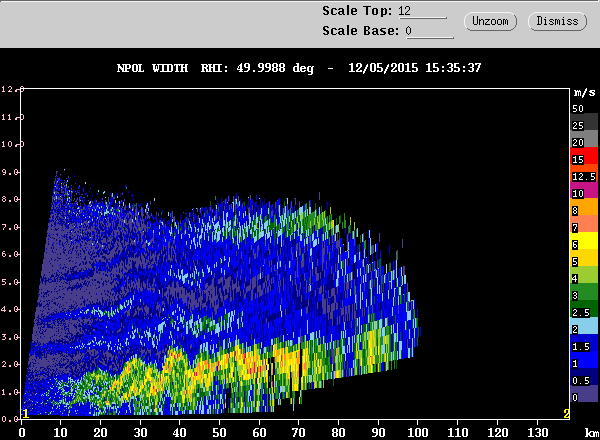
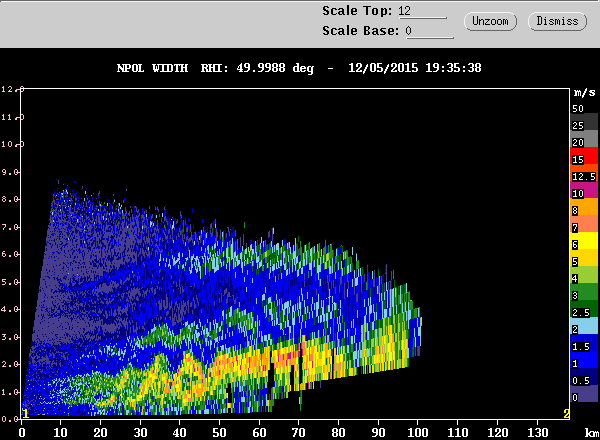
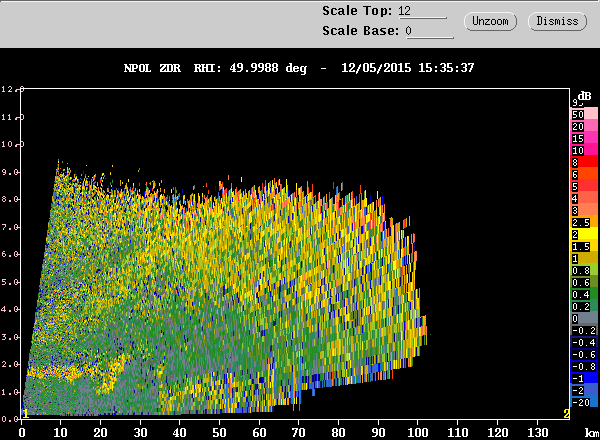
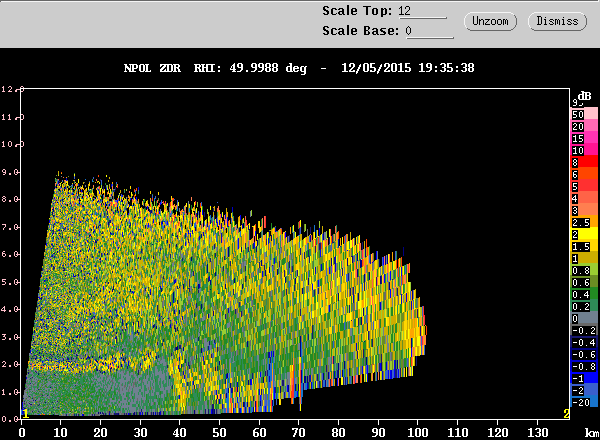
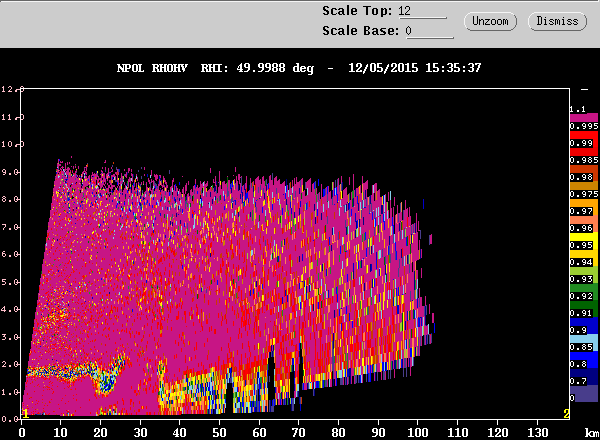
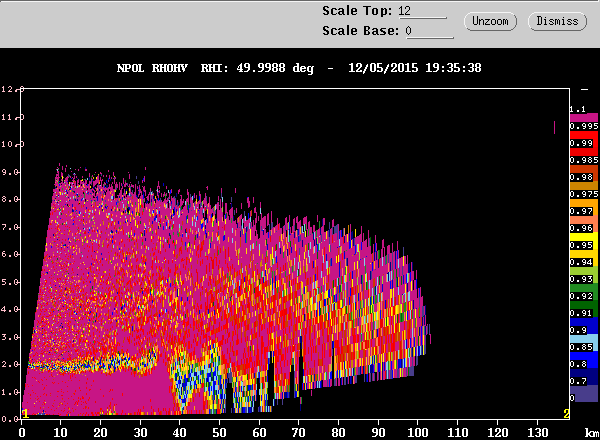
studies. Figure 11 shows the
waves on the NPOL radar at two times. At 1535 UTC
(left column), during the time of the flights
described above, the waves were beginning to develop.
They persisted for several hours, as is typical from
previous studies. The right column shows the waves
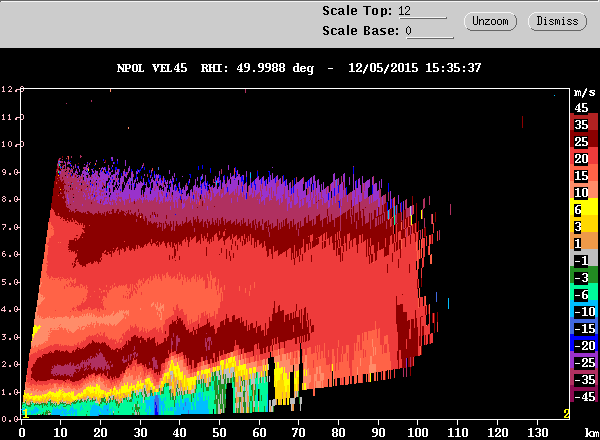
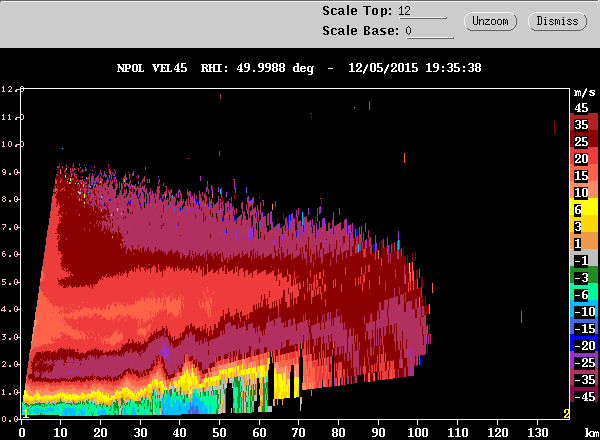
more strongly developed at 1935 UTC. Note that the
waves are striking in the radial velocity field
(second row of Figure 11). In
the third row of Figure 11
they are seen to produce a "braid echo" pattern in the
velocity spectral width (which is dominated by shear).
The braid echoes are known to be characteristic of KH
waves. Importantly, the dual-polarimetric fields ZDR
and rhohv (5th and 6th rows of
Figure 11) as well as reflectivity (top row) indicate
that a microphysical signature is associated with the
waves, which has been hypothesized in the literature.
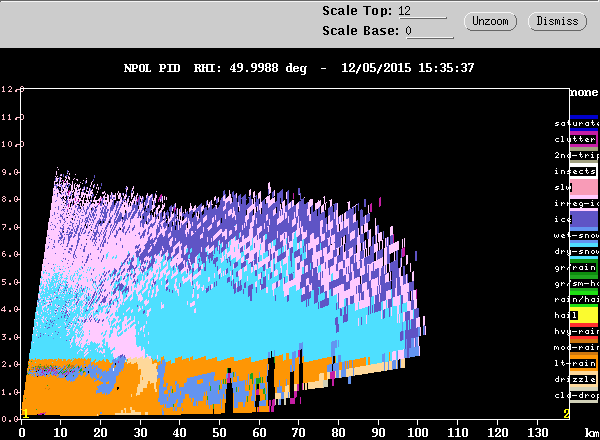
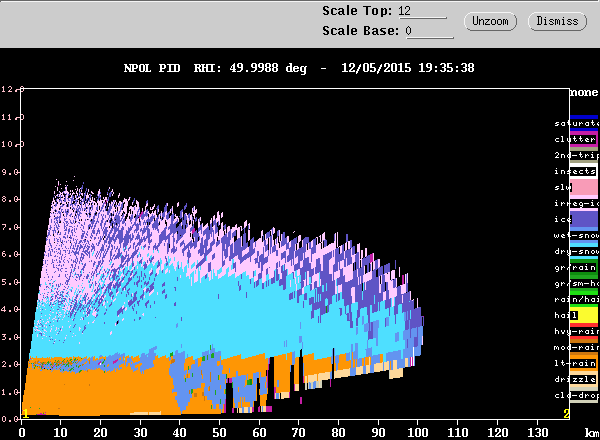
The particle identification field in the 7th row of Figure 11 also
indicates a microphysical impact; however, the
algorithm needs to be corrected for that field to be
trustworthy. The particle identification field is a
function of temperature, which is only estimated in
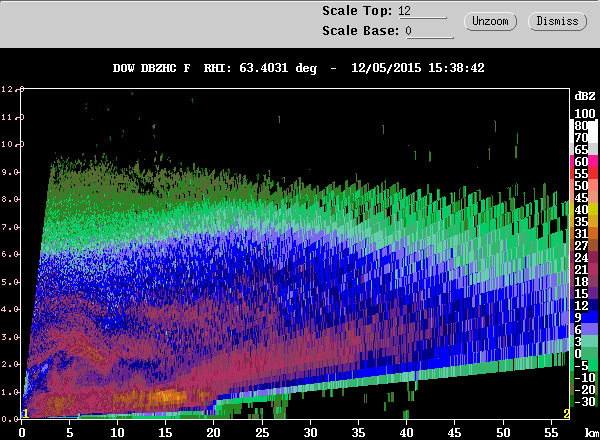
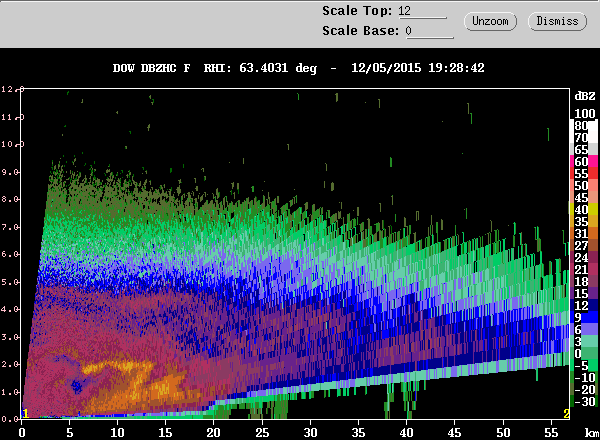
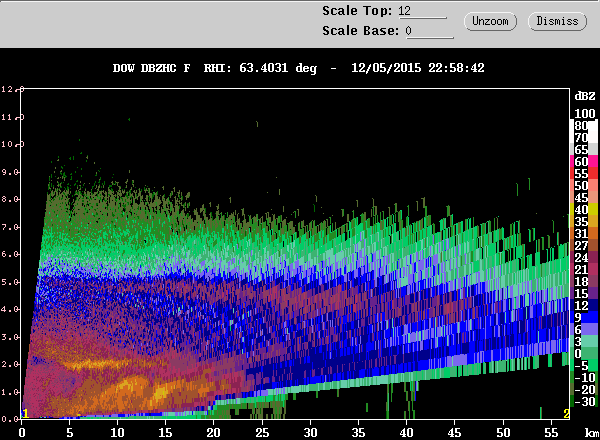
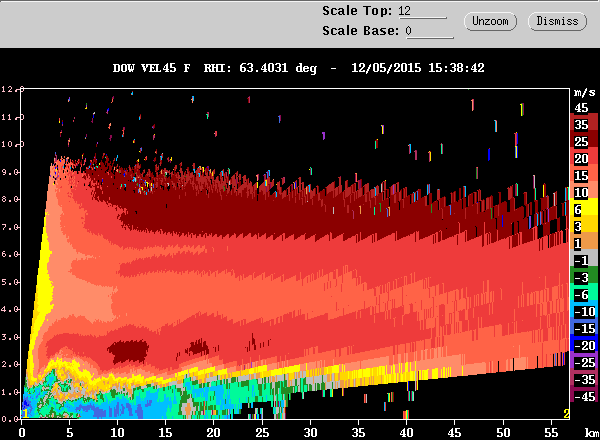
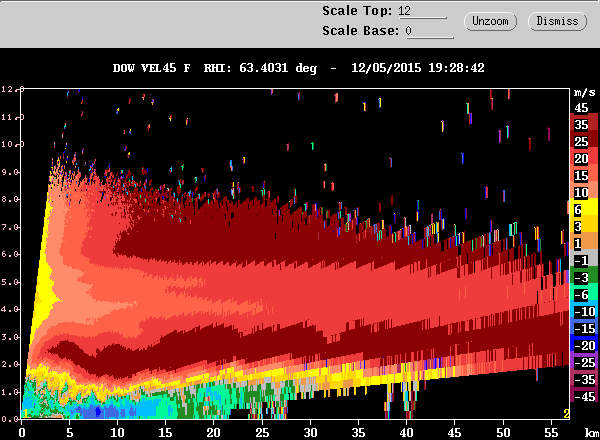
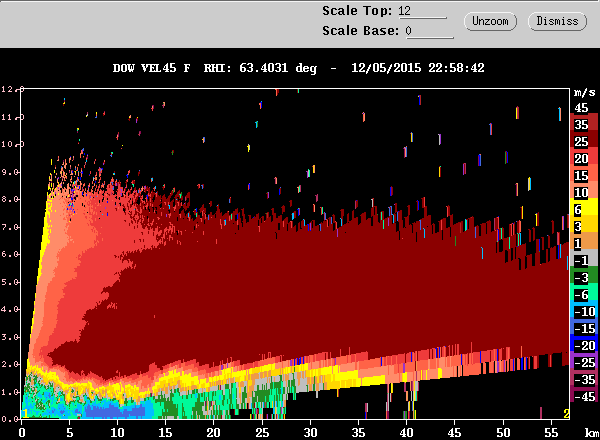
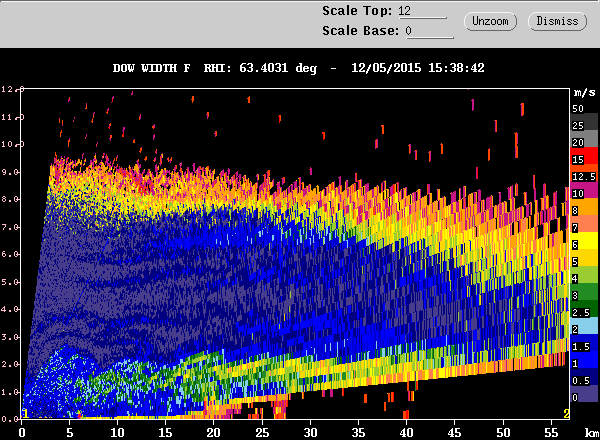
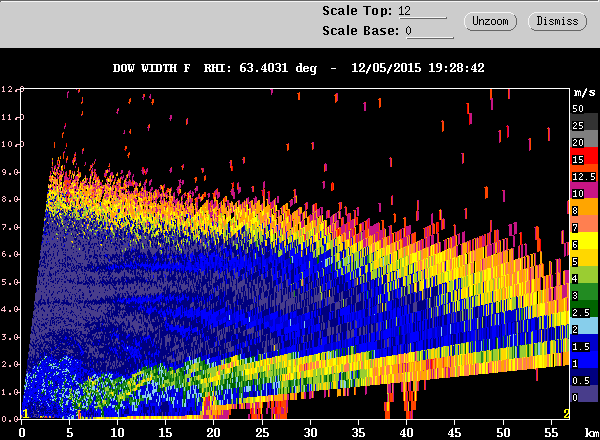
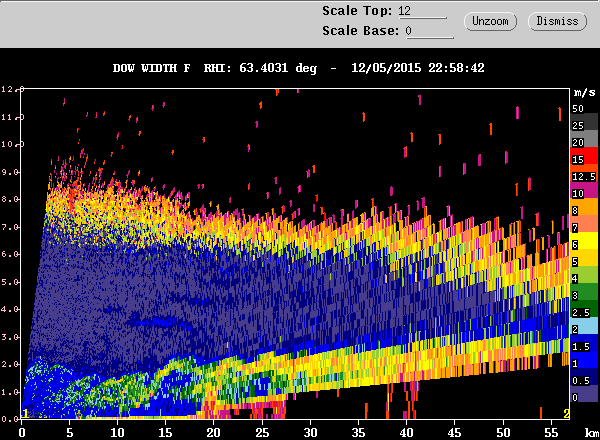
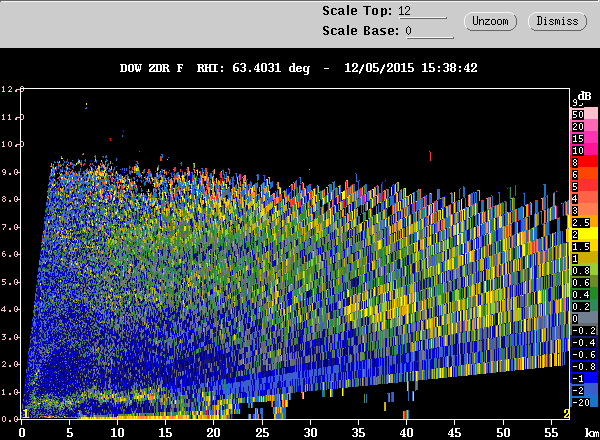
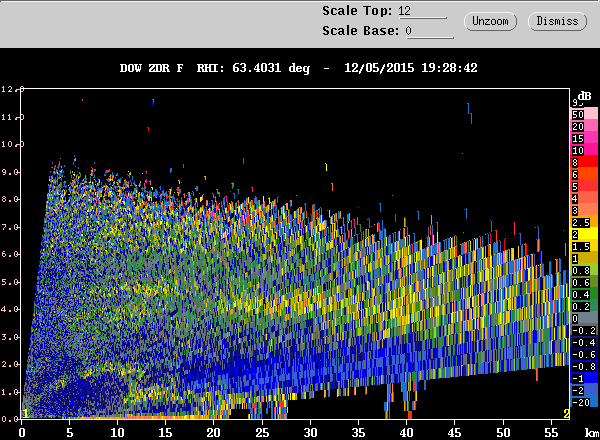
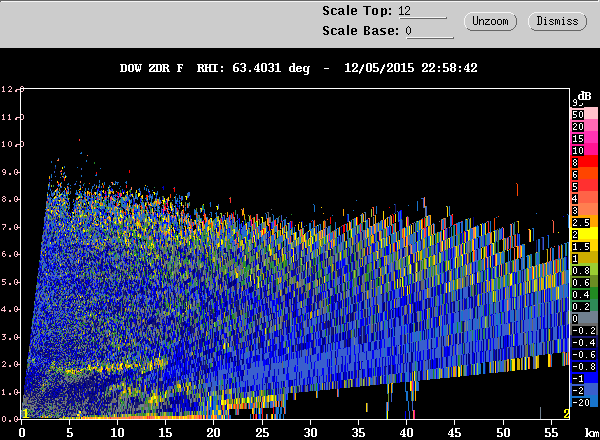
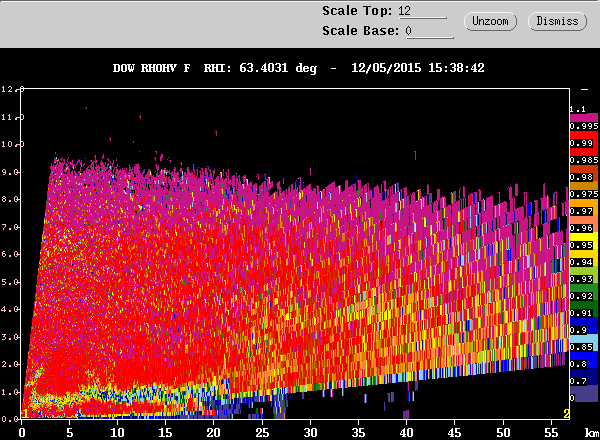
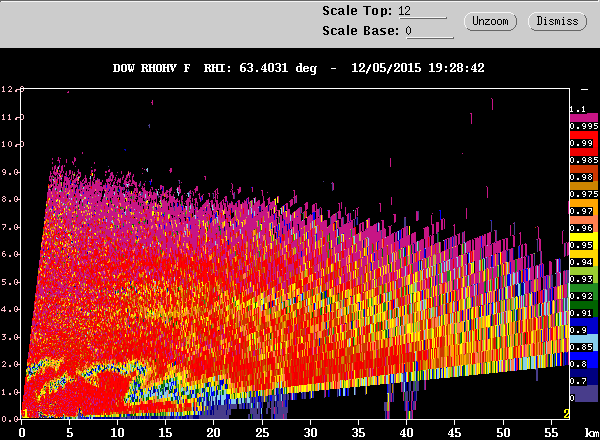
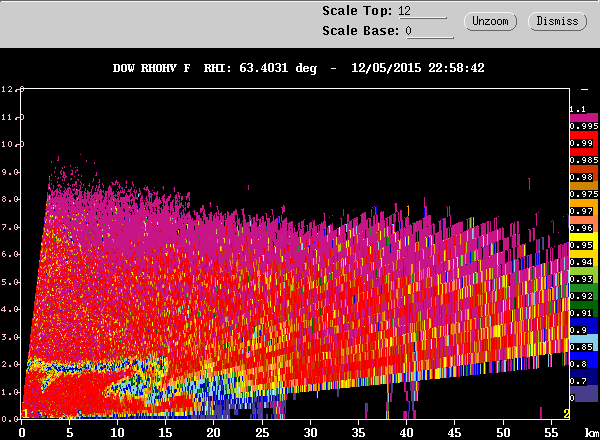
these quick-look images. The DOW data in the Quinault
Valley also detected the KH waves (Figure
12). The examples from the DOW are at 1538,
1928, and 2259 UTC on 5 December. However, close
inspection of the DOW data show that the waves were
present in weakening form until ~0300-0400 UTC on 6
December.
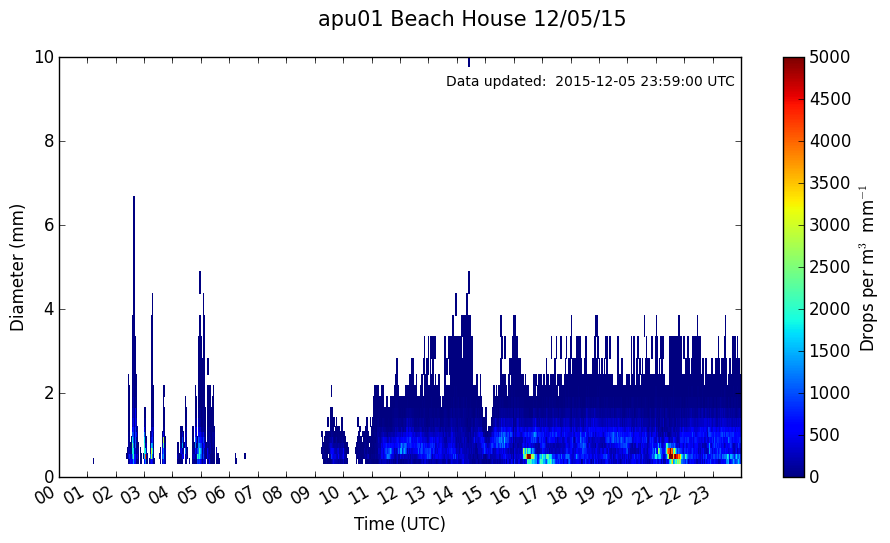
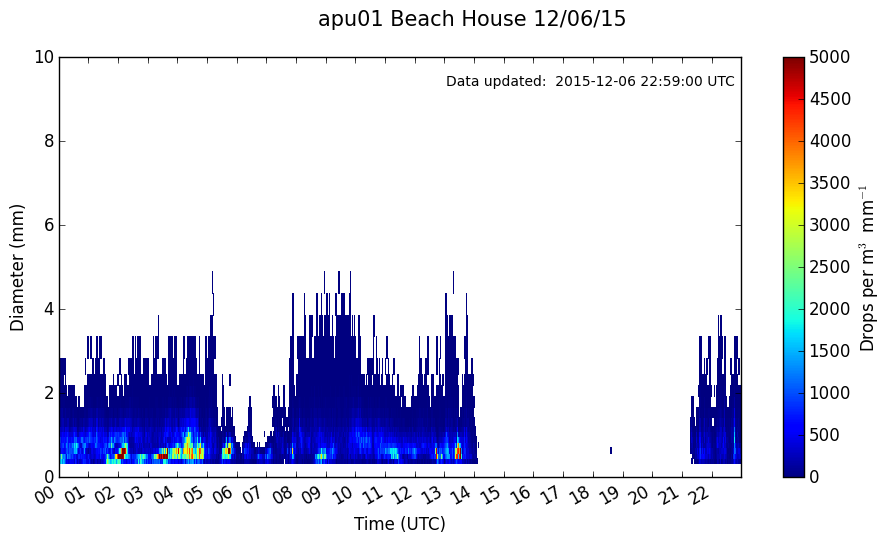
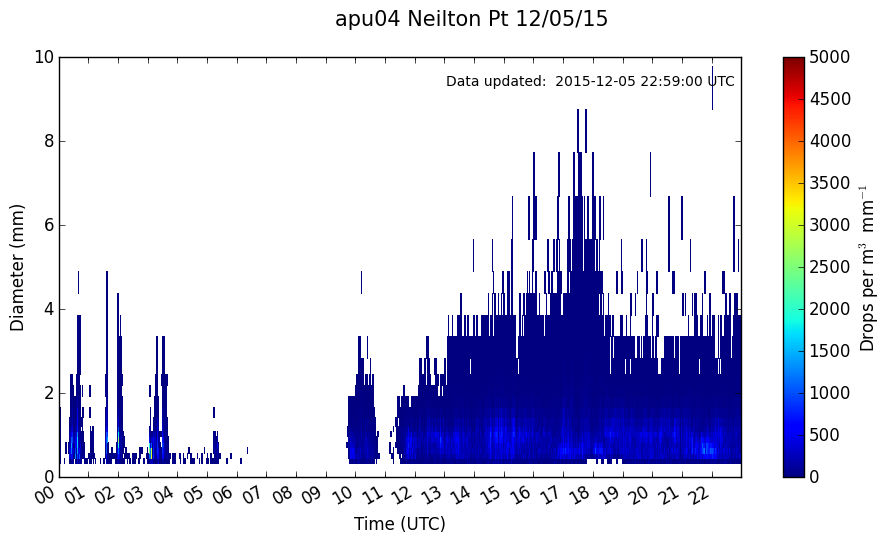
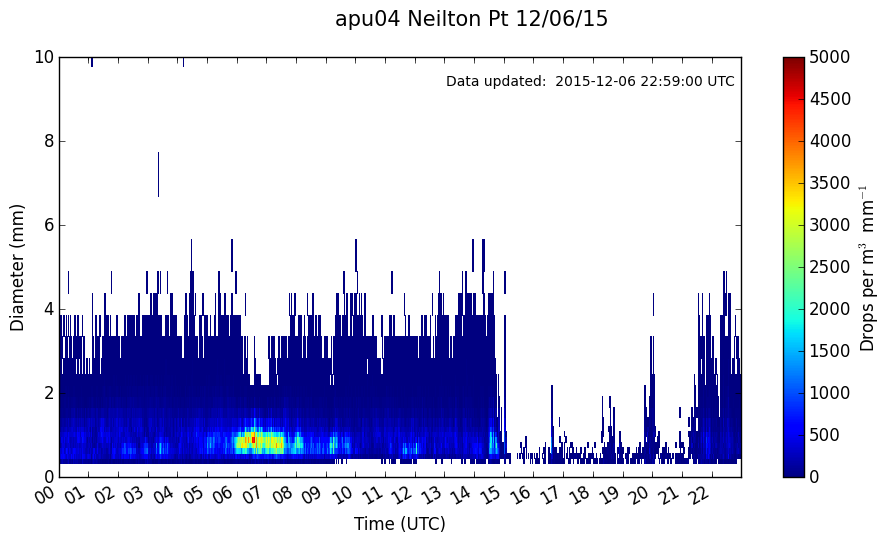
The particle size distributions in the Quinault region
mostly showed broad distributions containing large
particles (Figure 13). These are
the types of distributions that occur when substantial
parts of the precipitation are from melted snow. At
higher elevations some of the precipitation was in the
form of snow. The Neilton Point data in Figure 13 show
some particles reaching 7-8 mm, which are almost
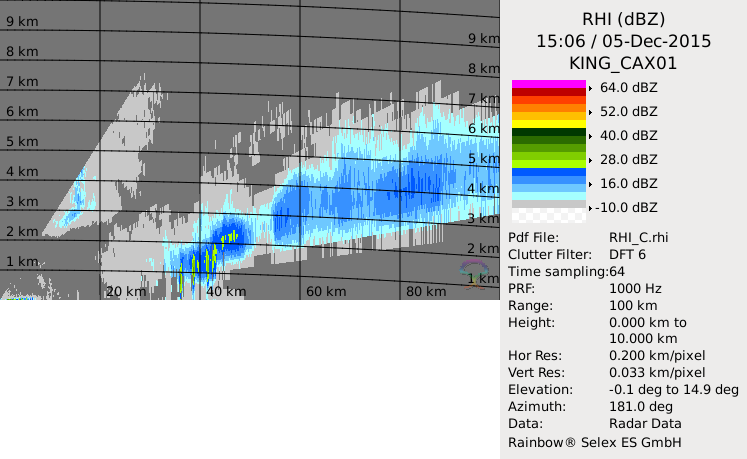
surely snow. On the leeside of the Olympic Range, rain
shadow dynamics prevented large precipitation
accumulations (Figure 1).
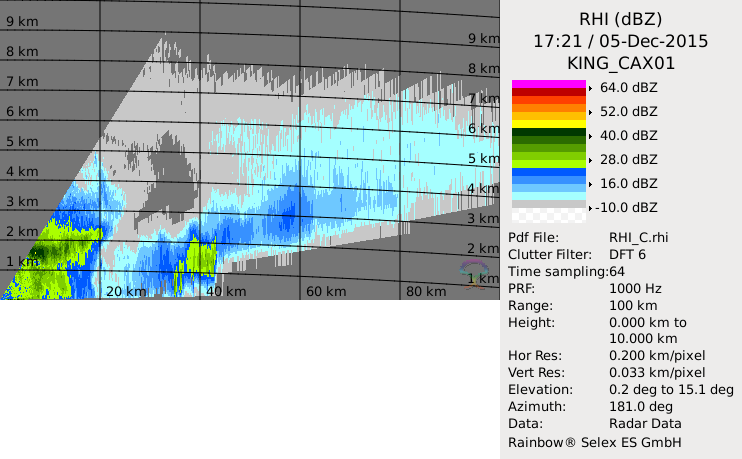
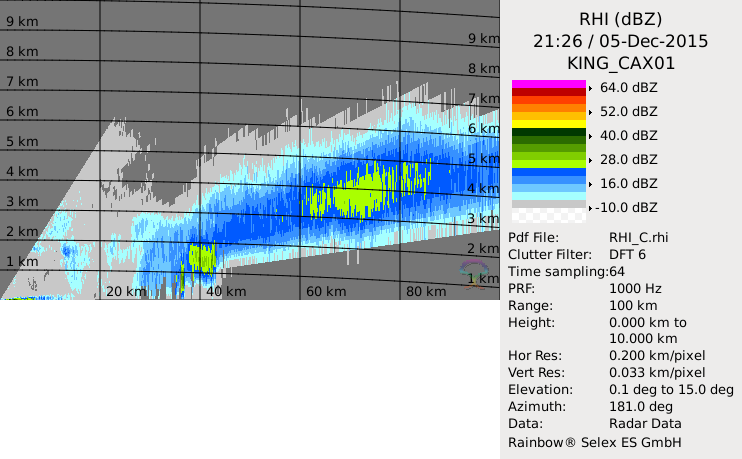
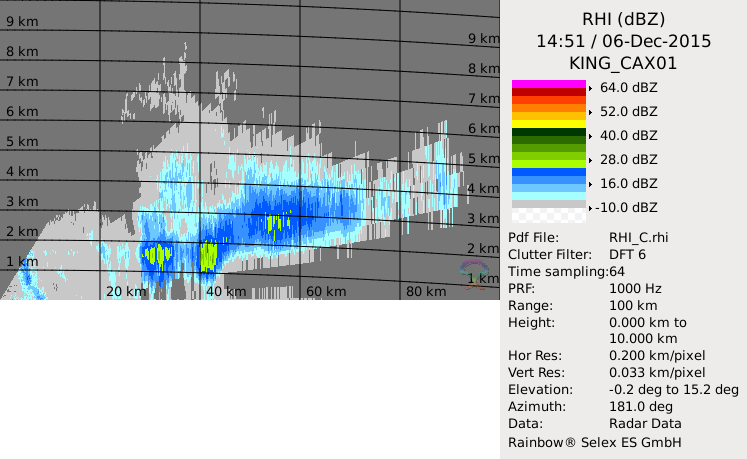
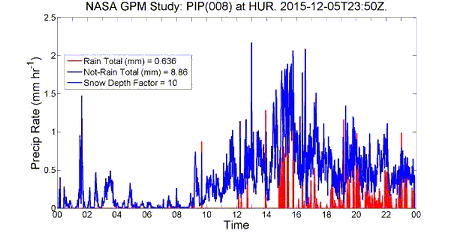
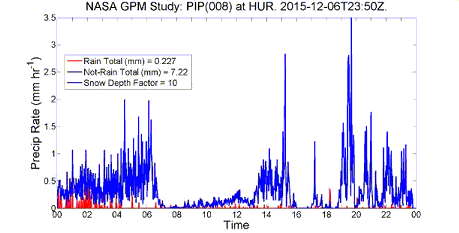
However, light snow was falling throughout the period
of the storm at Hurricane Ridge (see the radar data
from the Environment Canada X-band radar in Figure 14). From about 1200 UTC
on 5 December until about 0600 on 6 December, the snow
was mixed with light rain at the Hurricane Ridge site
(Figure 15).
|