The weather
events in this 24 h period were defined by the passage
of two rapidly moving short waves, which brought heavy
precipitation into the OLYMPEX area. Aircraft did not fly, and
the DOW radar operation was in a rest period. The NPOL
radar was off for part of the period but collected key
data in the both short waves. The NPOL revealed a
variety of interesting convective and mesoscale
structures and outbreaks of small scale superimposed
waves rippling through the precipitation areas. The
Environment Canada radar operated, and the ground
sites collected interesting data on both snow and rain
characteristics in both waves.
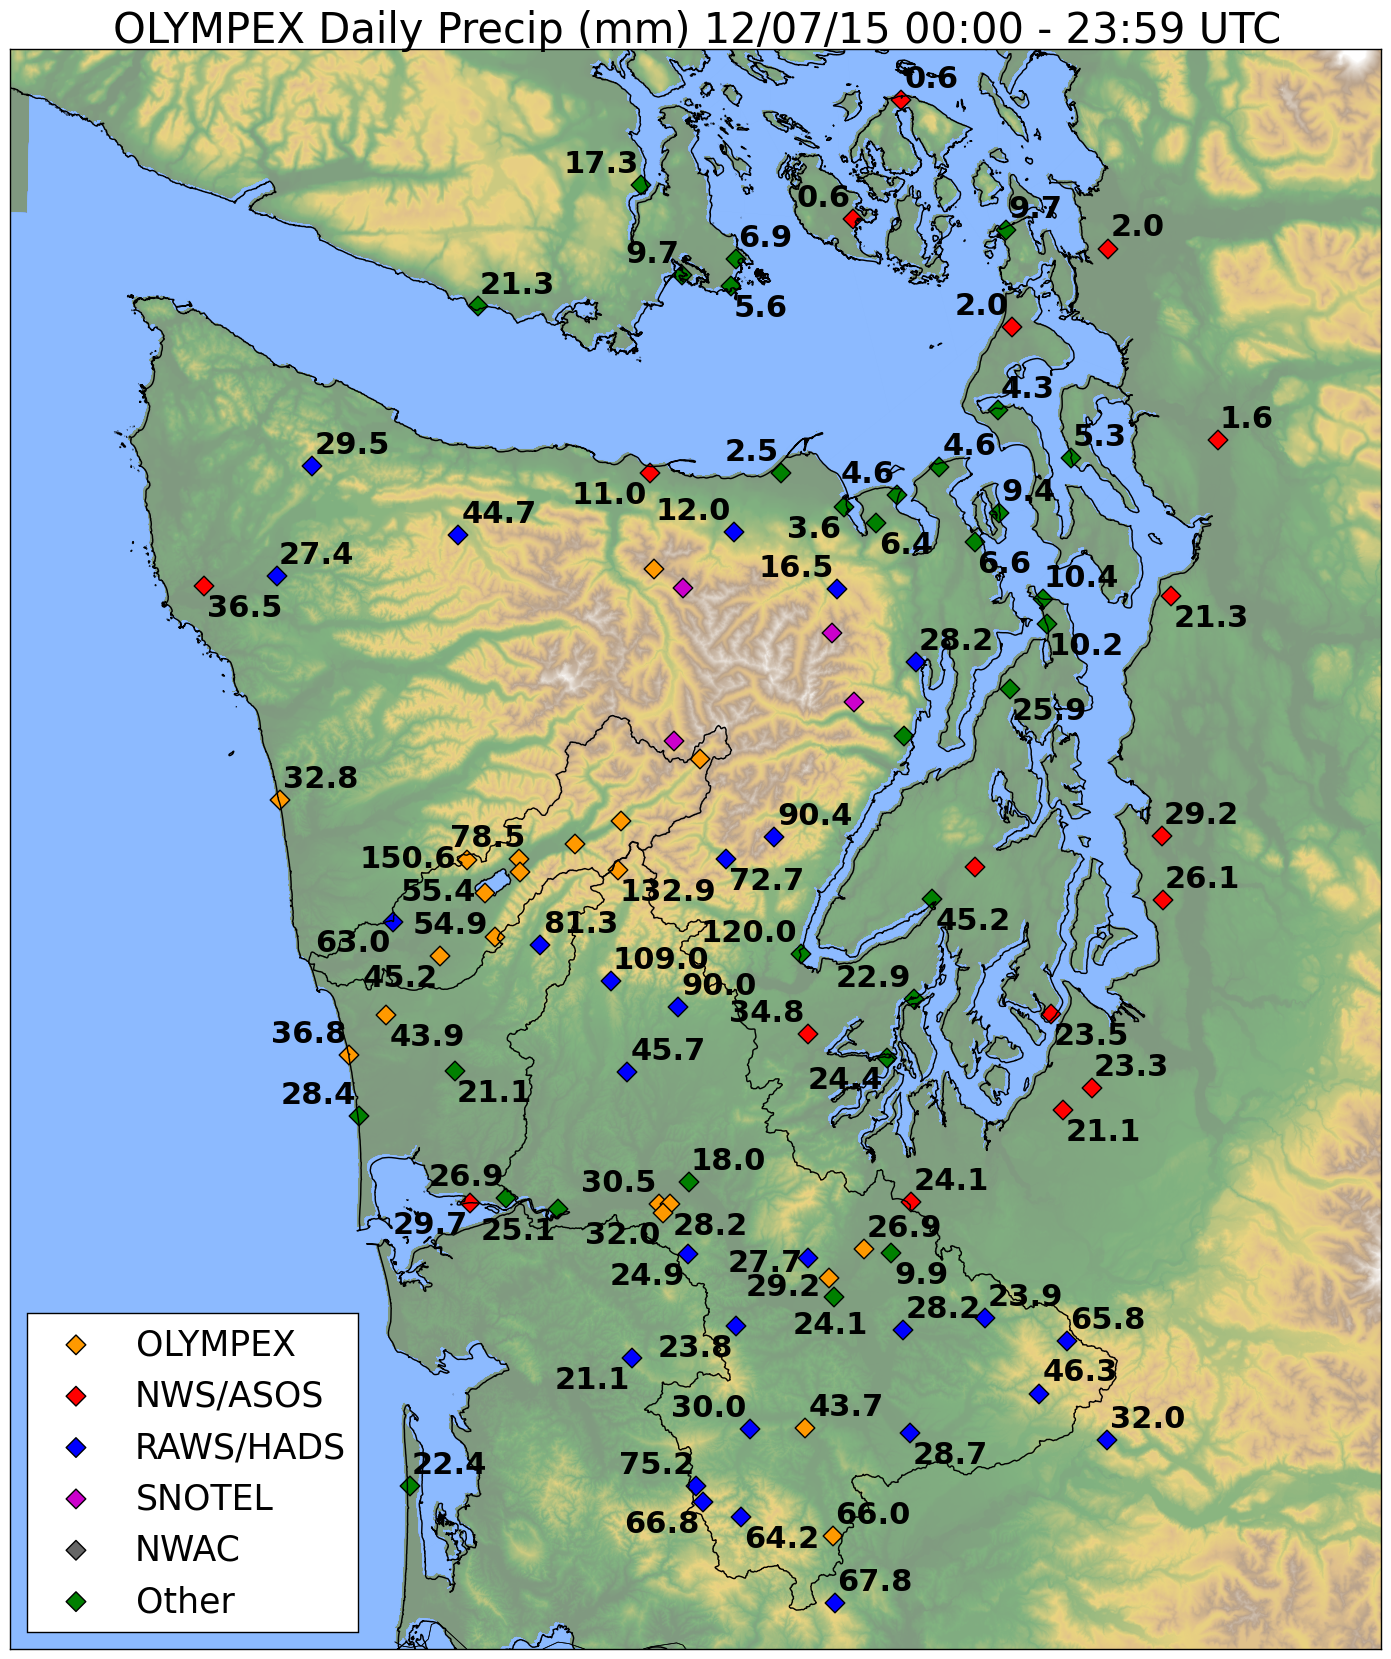
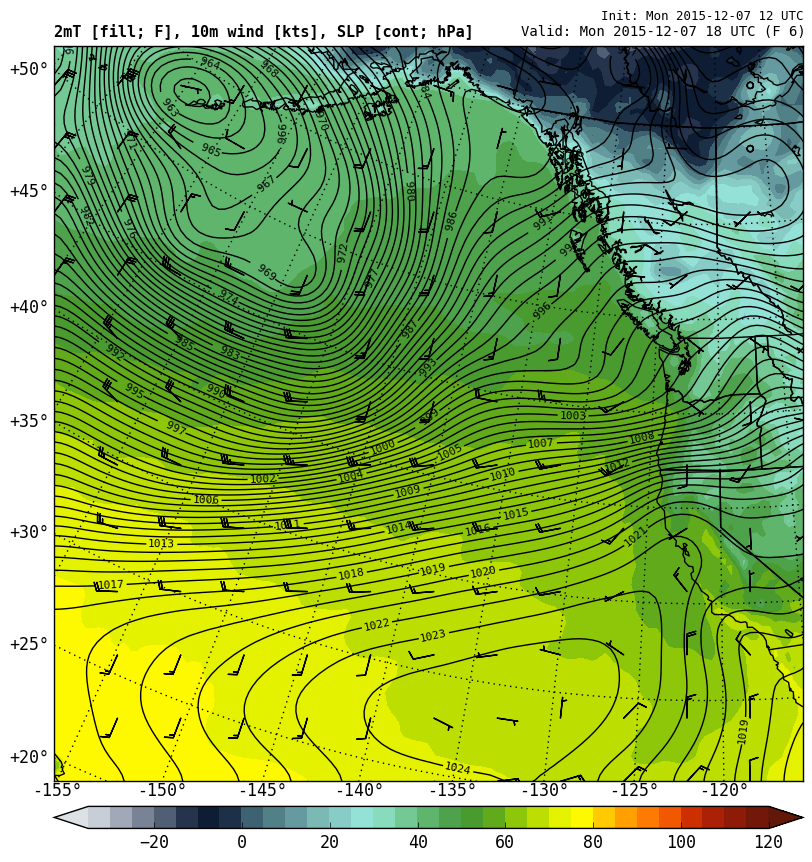
The precipitation amounts due to the combination of
both waves ranged from ~30 mm along the coast to
~100-200 mm on the windward slopes of the Olympic
Mountains, especially on the south-facing barriers (Figure 1). The Quinault Valley
lay in the heavy precipitation area. The two waves
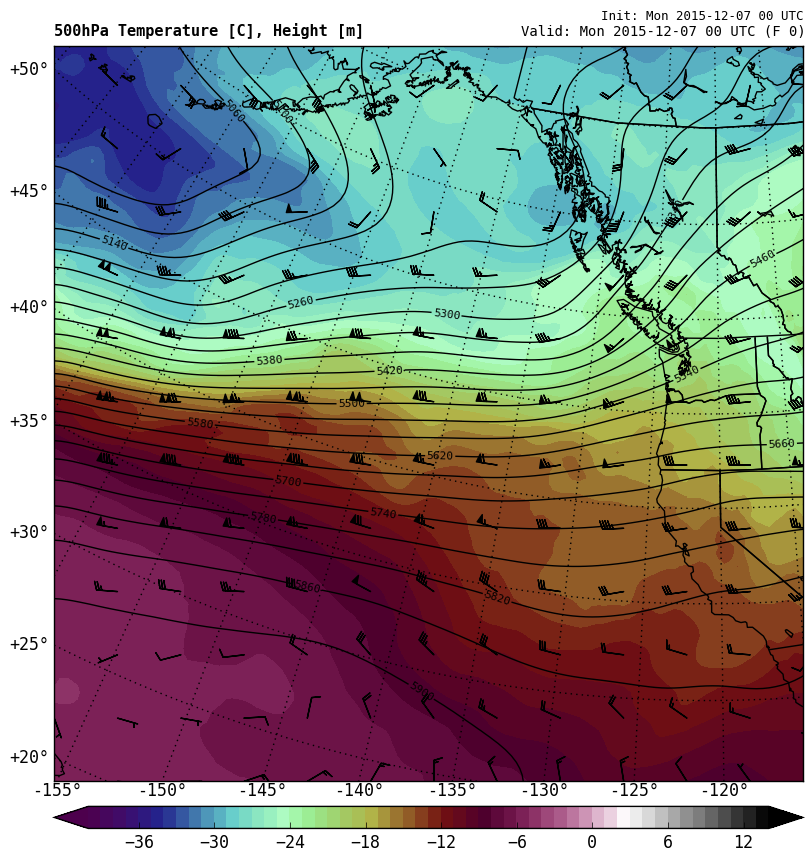
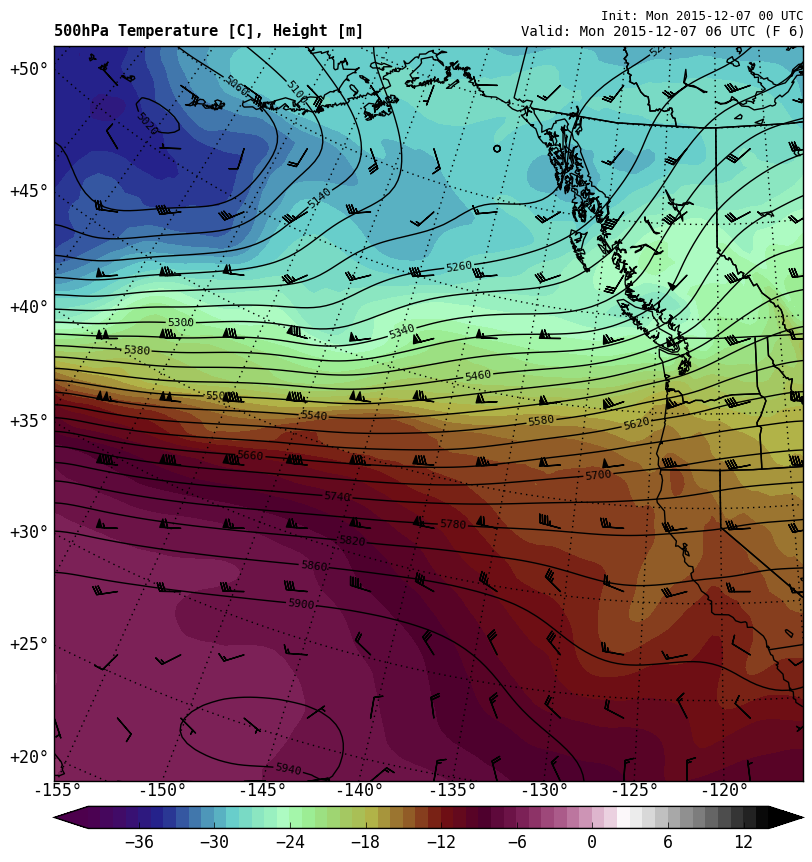
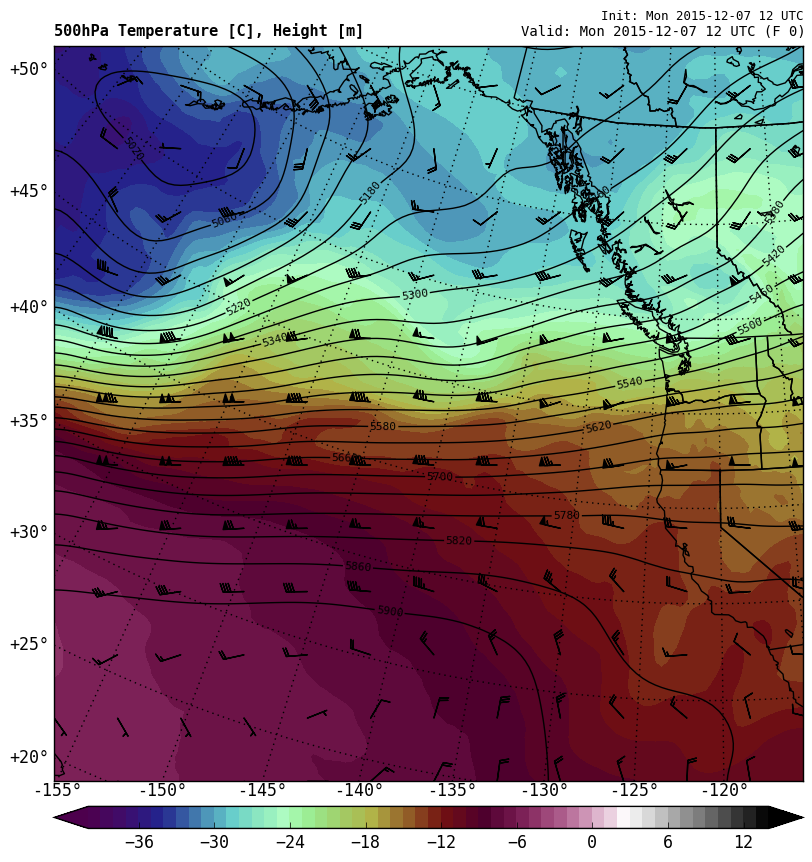
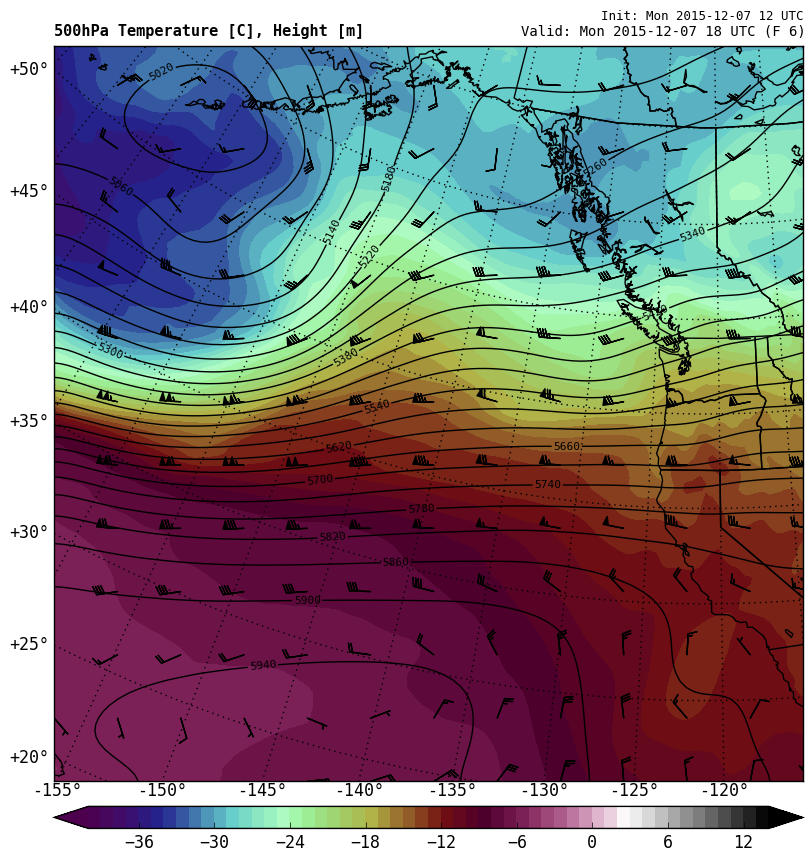
were ripples in the jet of strong flow at 500 hPa. Figure 2 shows their rapid
progression over the OLYMPEX area. The two waves also
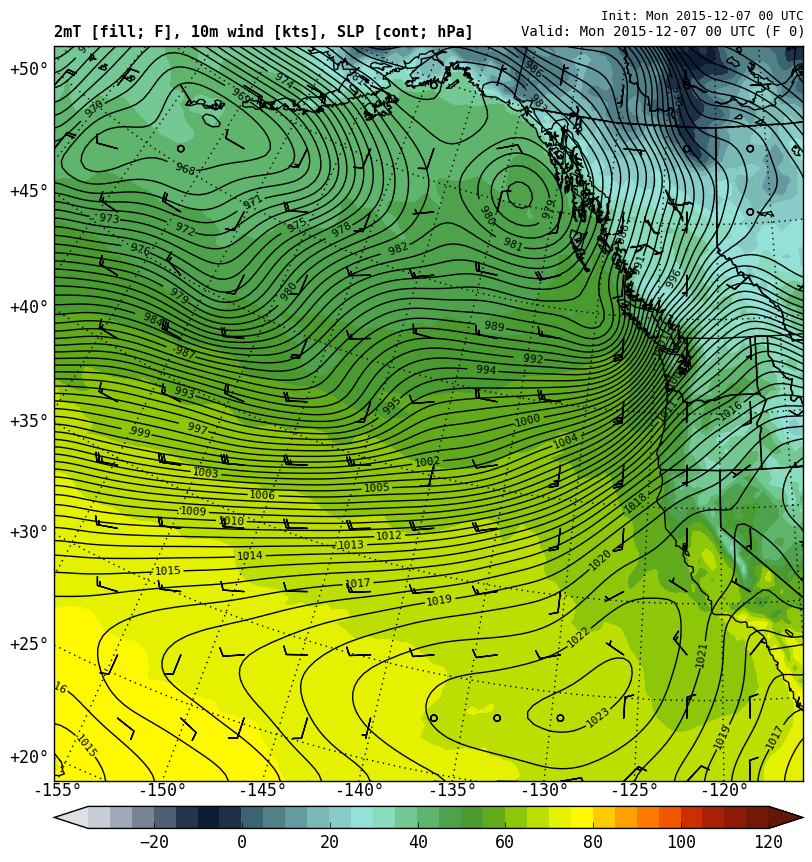
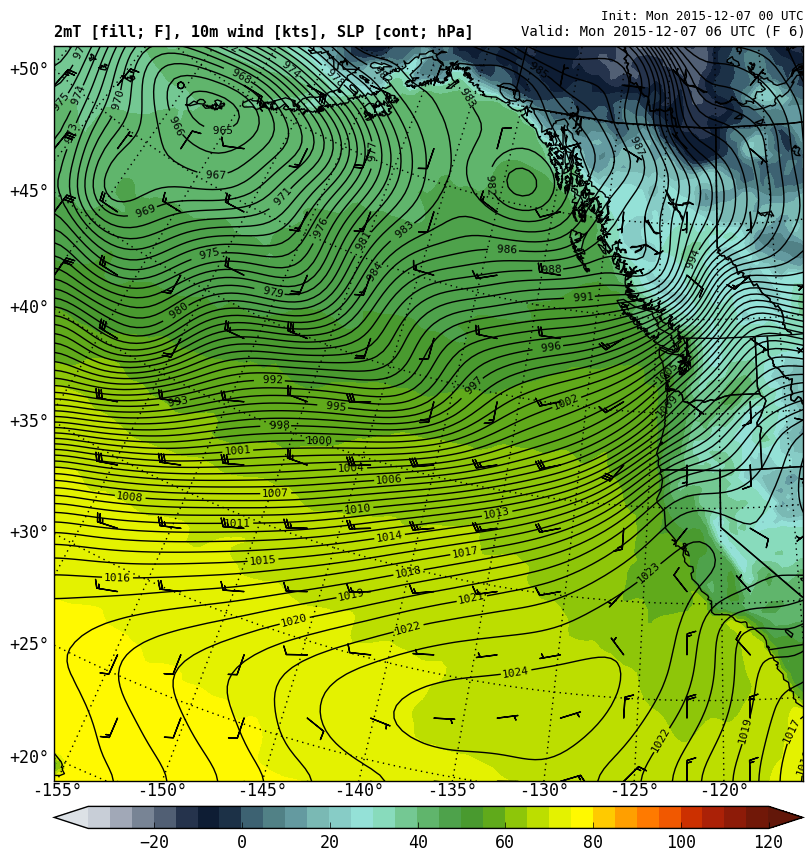
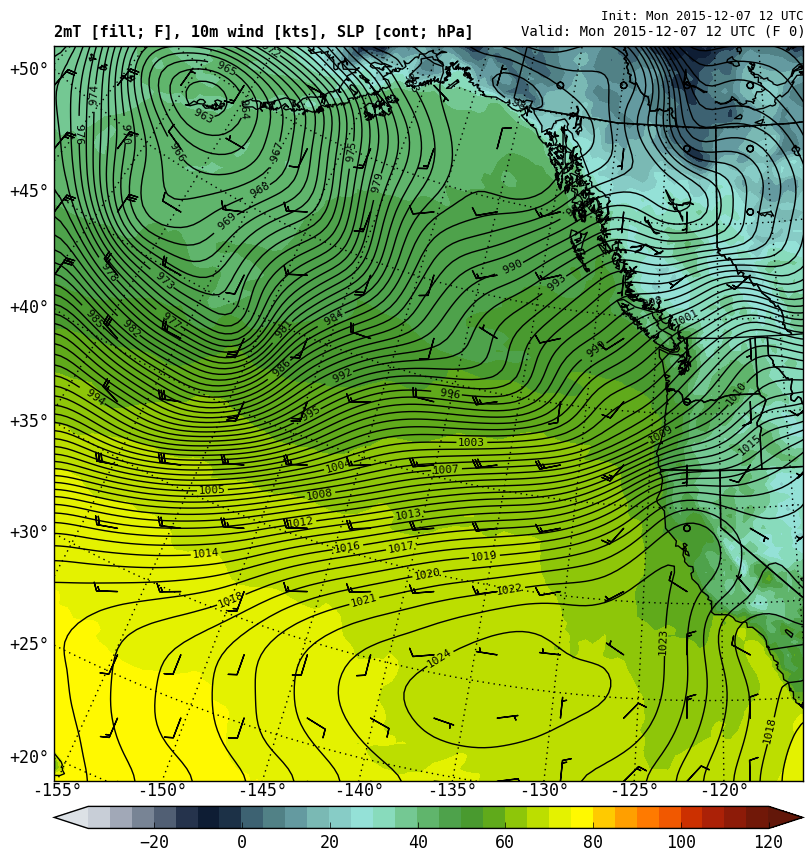
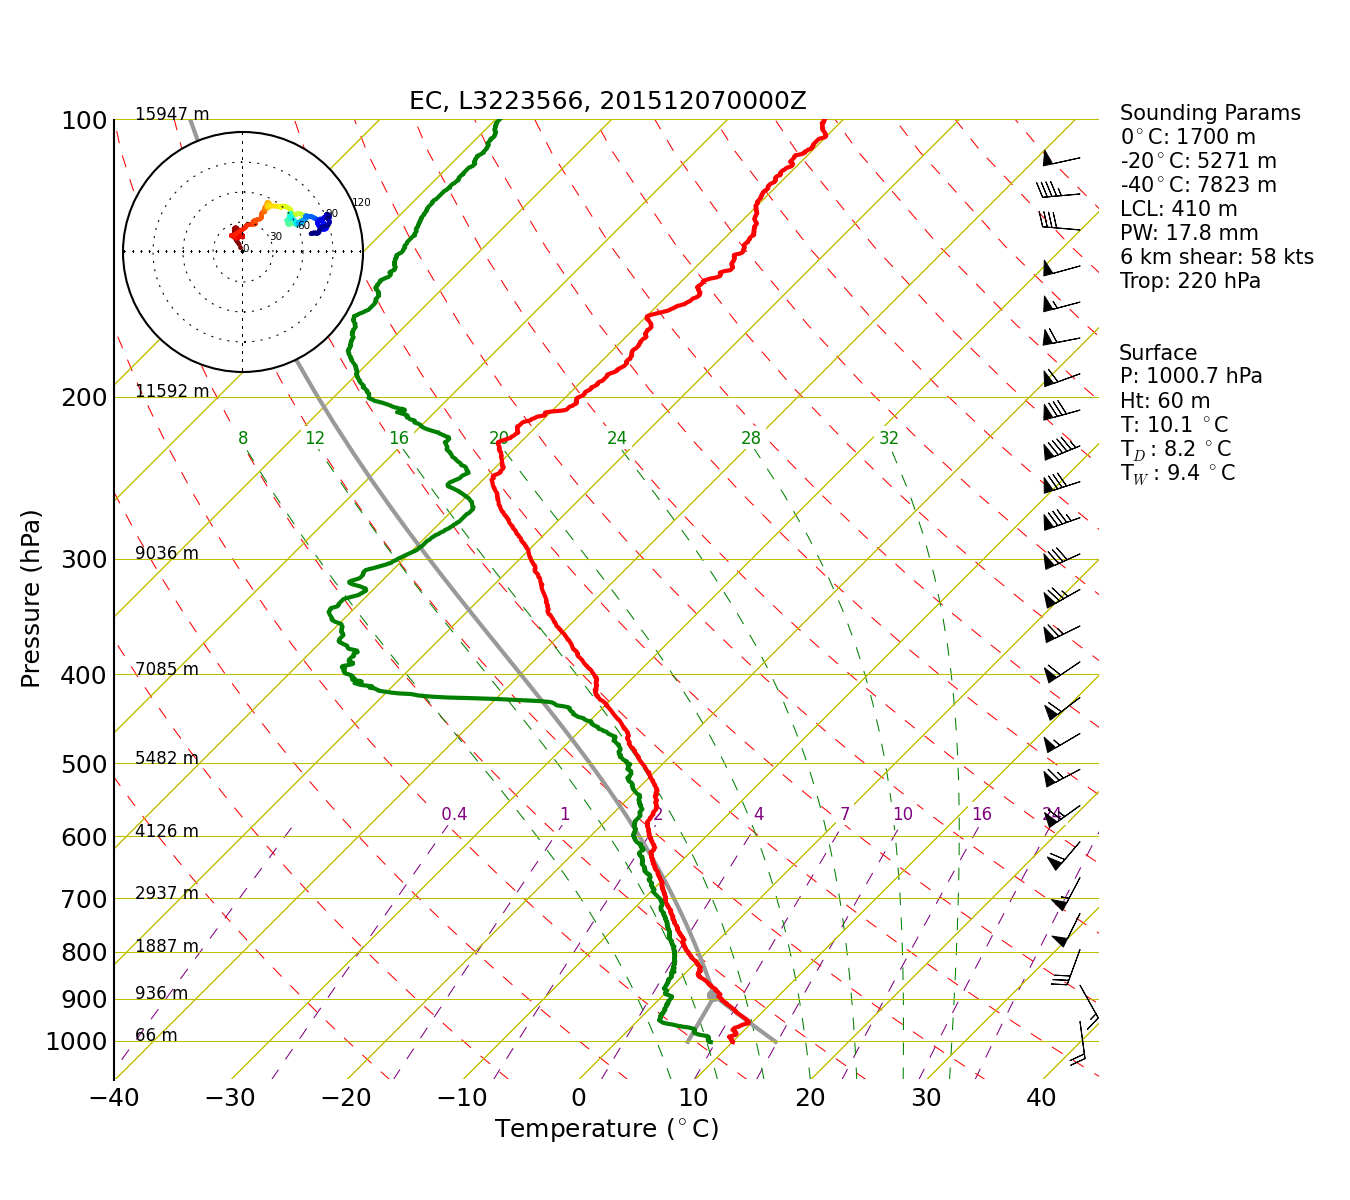
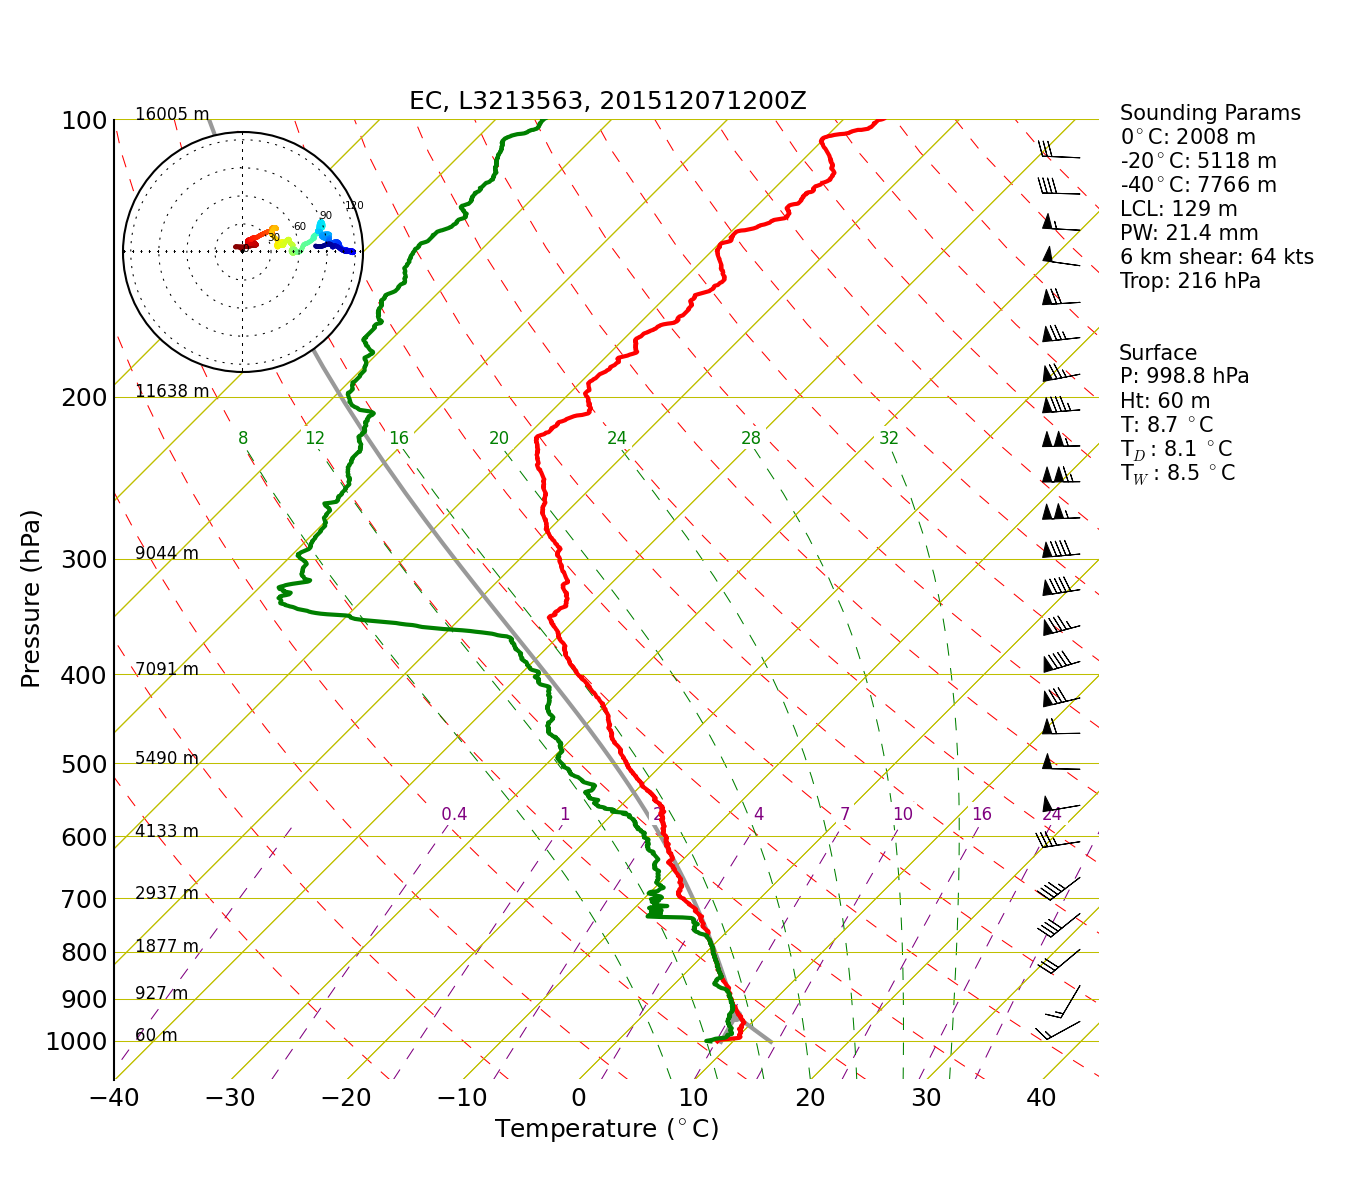
appear as ripples in the surface isobars (Figure 3). Soundings during the 24 h
period all show strong very strong winds associated
with the jet containing the short waves, except near
the surface where the winds were relatively moderate
and more southerly, even slightly southeasterly in the
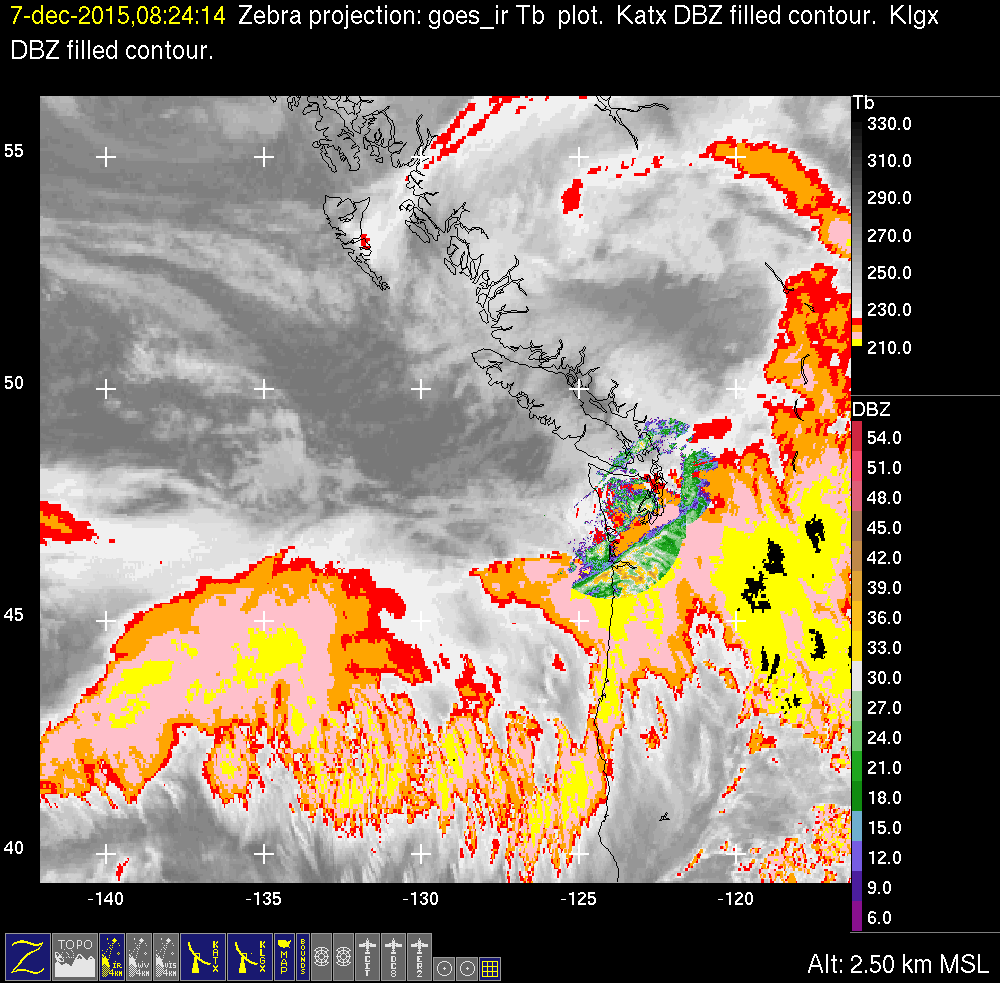
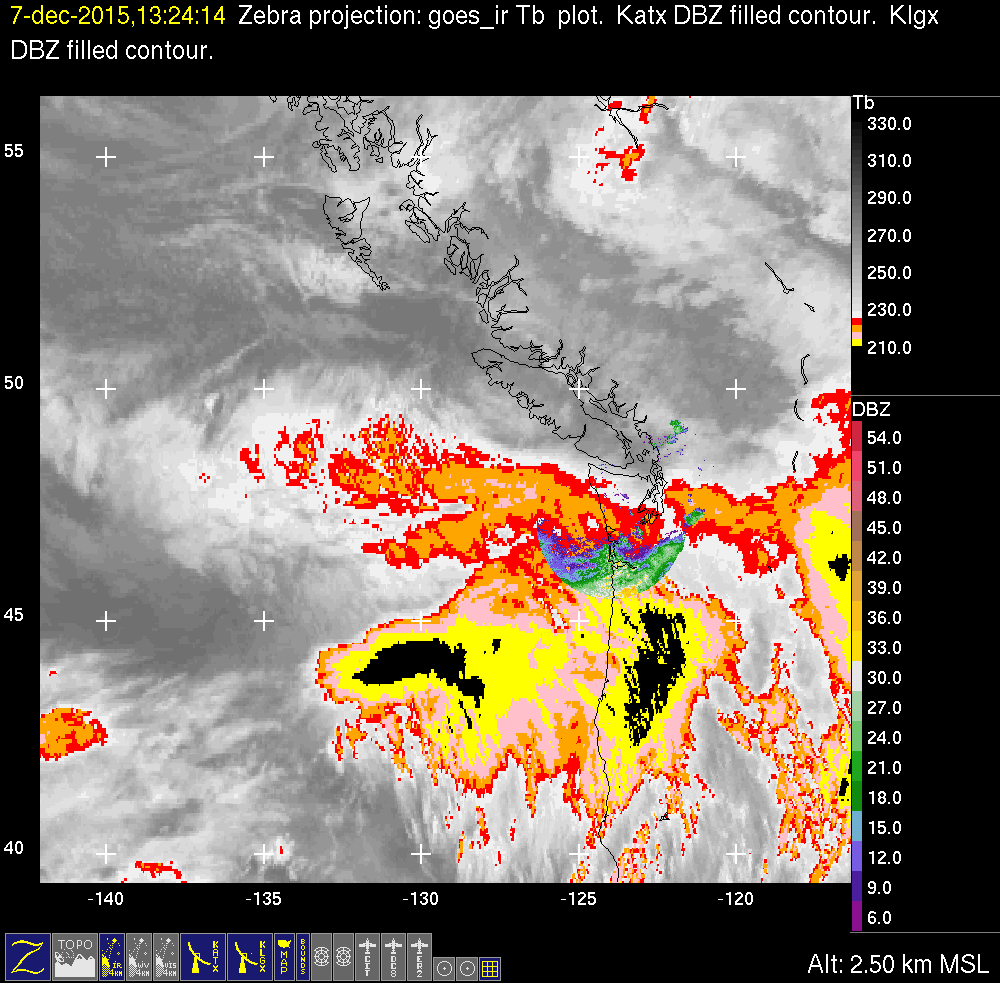
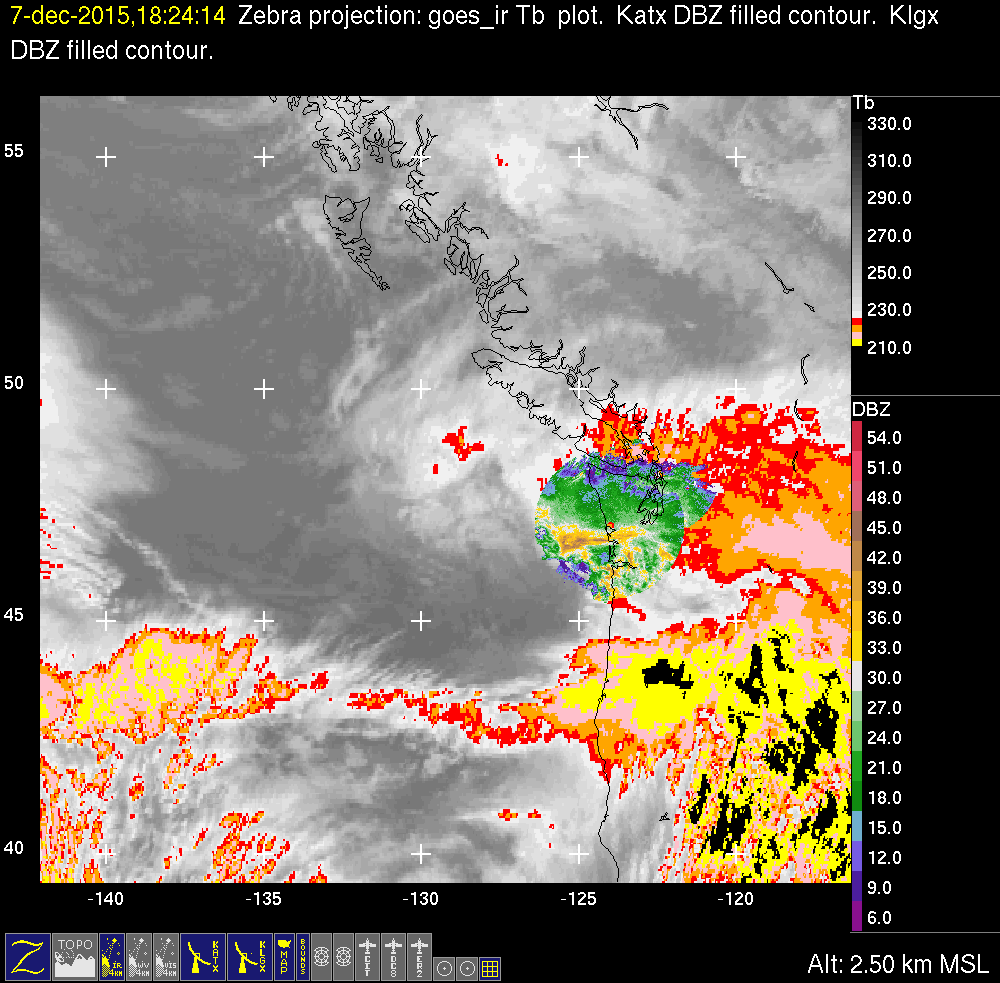
earlier hours (Figure 4). The
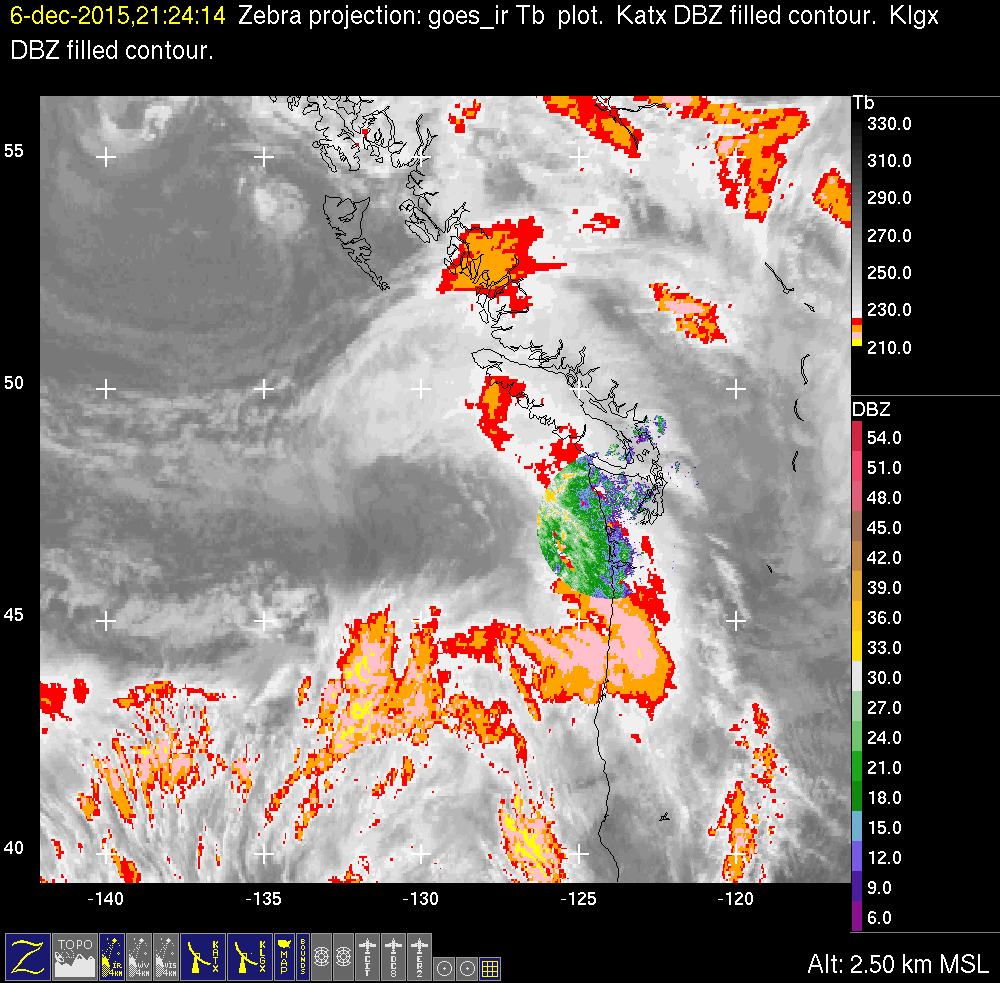
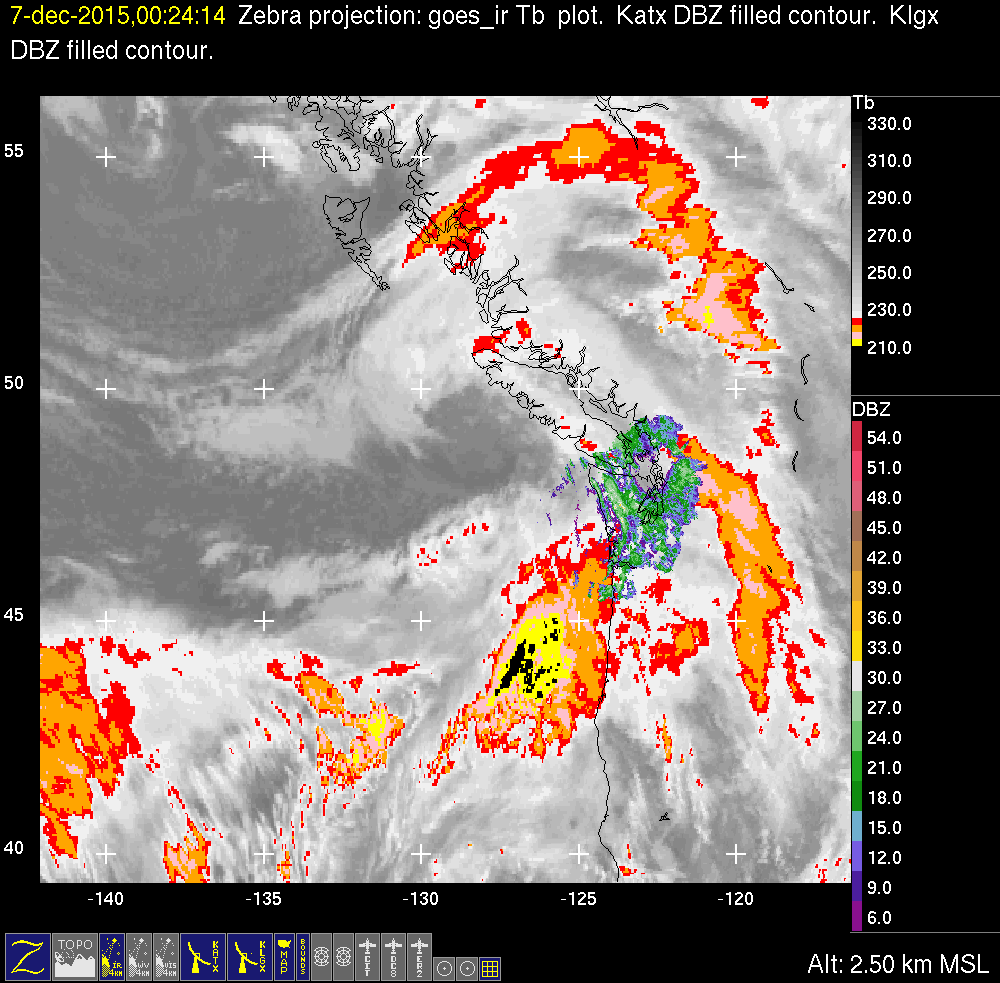
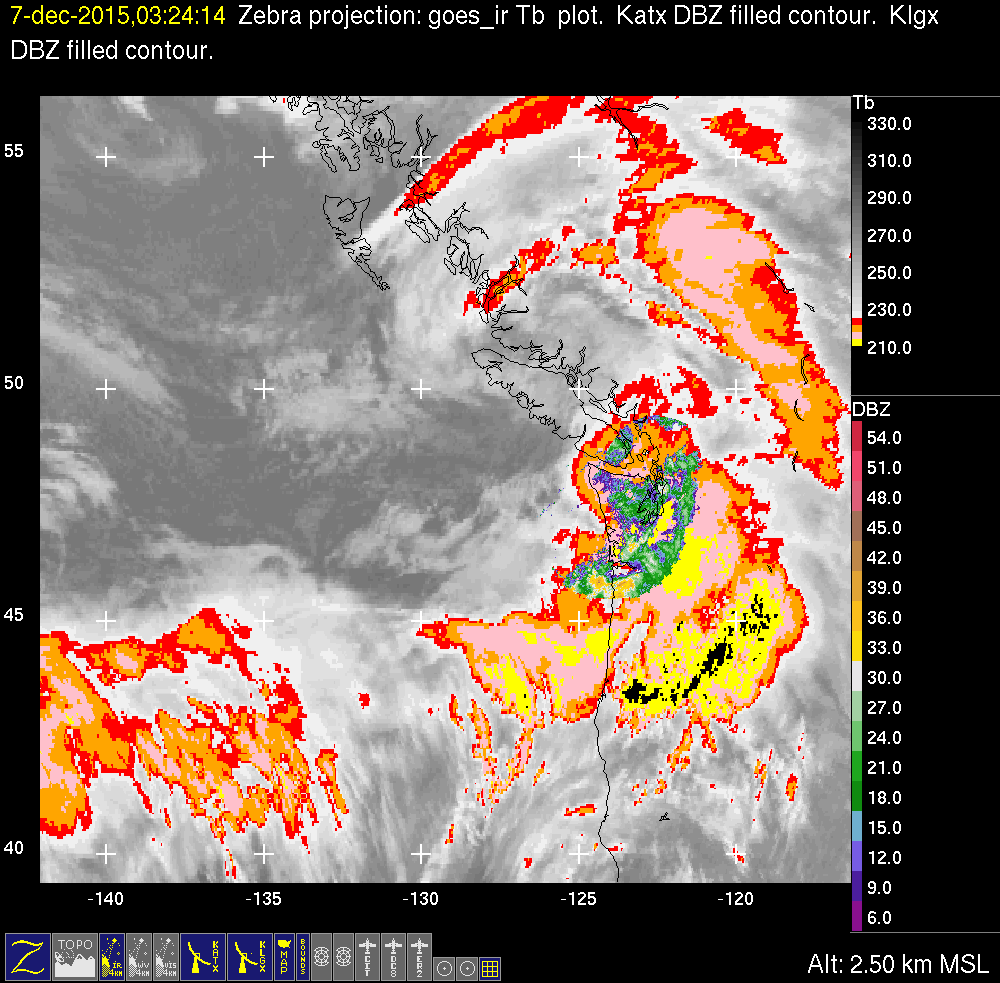
top row of infrared and radar imagery in Figure 5 shows the cloud
system of the fist wave passing west-to-east across
the Olympic Peninsula. The second row of images shows
the second wave developing to the west, producing a
very low-temperature cloud top, and containing a
precipitation area that moved into radar range from
the south.
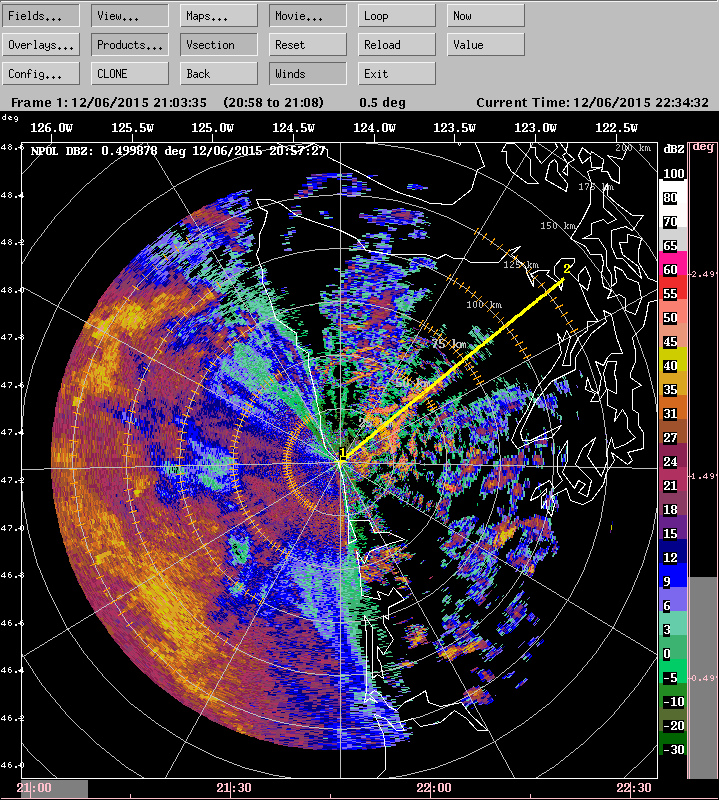
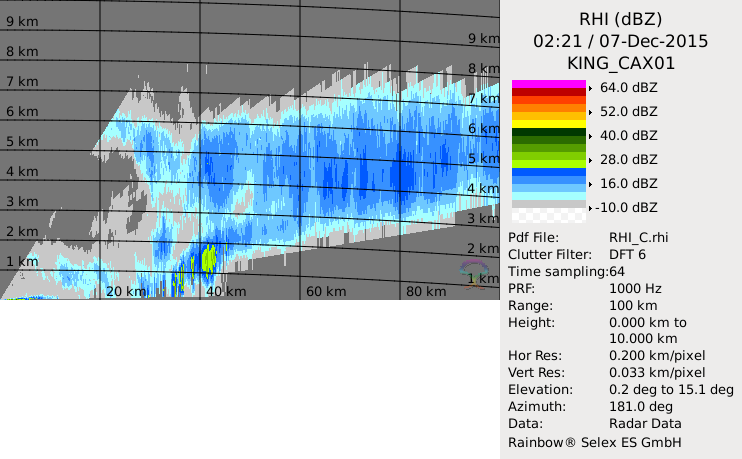
The radar pattern in Figure 6
shows convective echoes over the Quinault Valley
behind the previous frontal system (5-6
December) and underneath the leading echo
overhang of the first wave on 7 December. Not the
shear layer in the spectrum width parameter marking
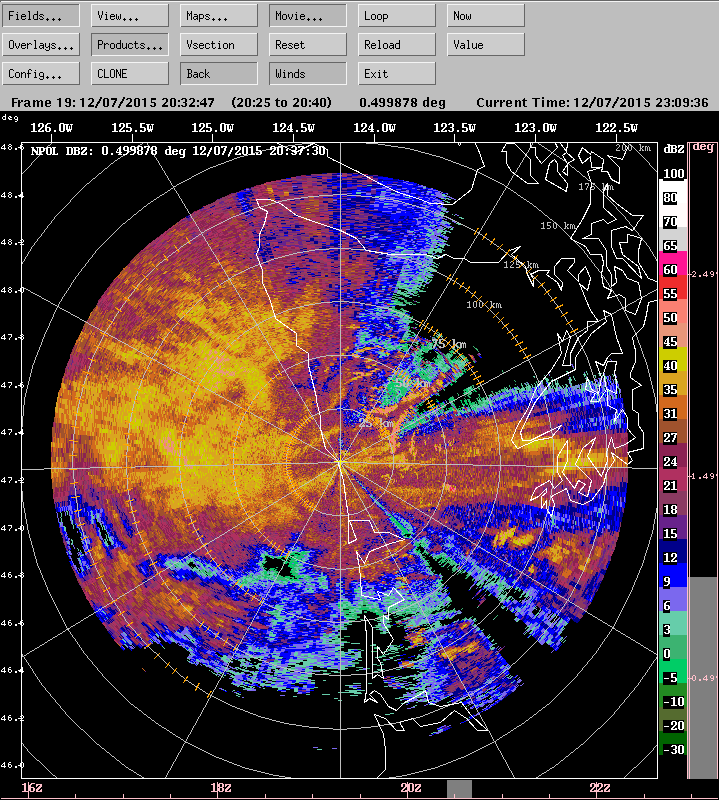
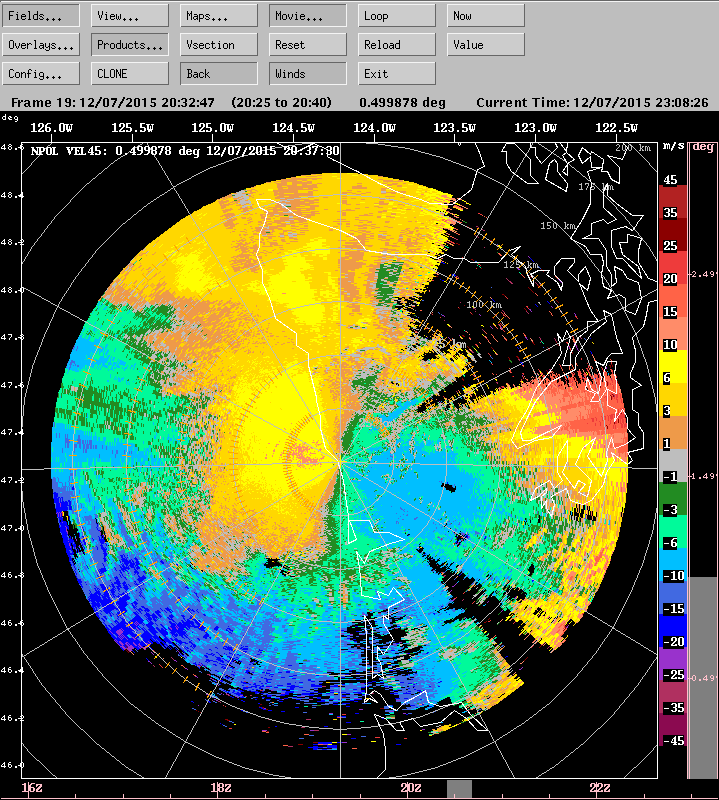
the shear at the base of the overhang. The PPIs in the
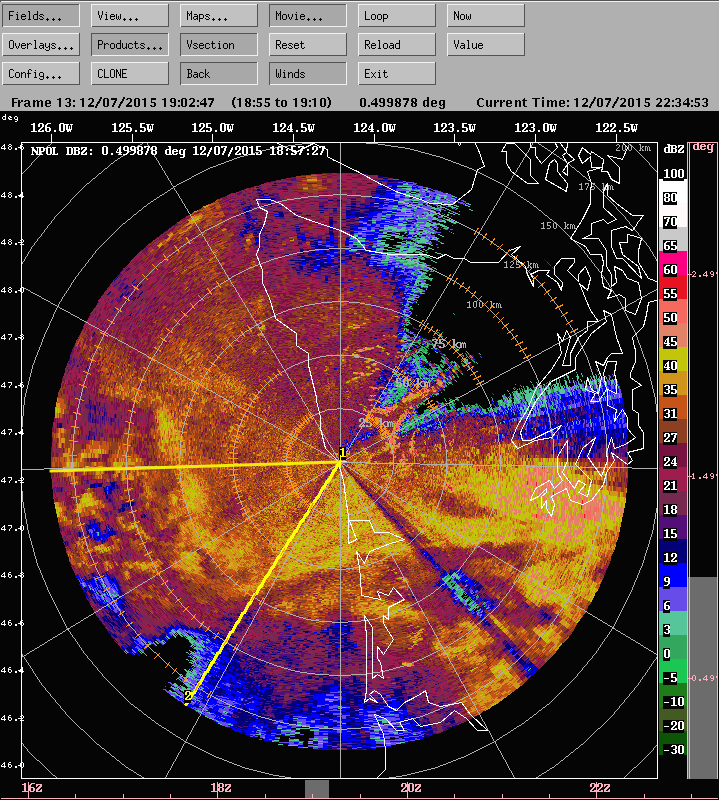
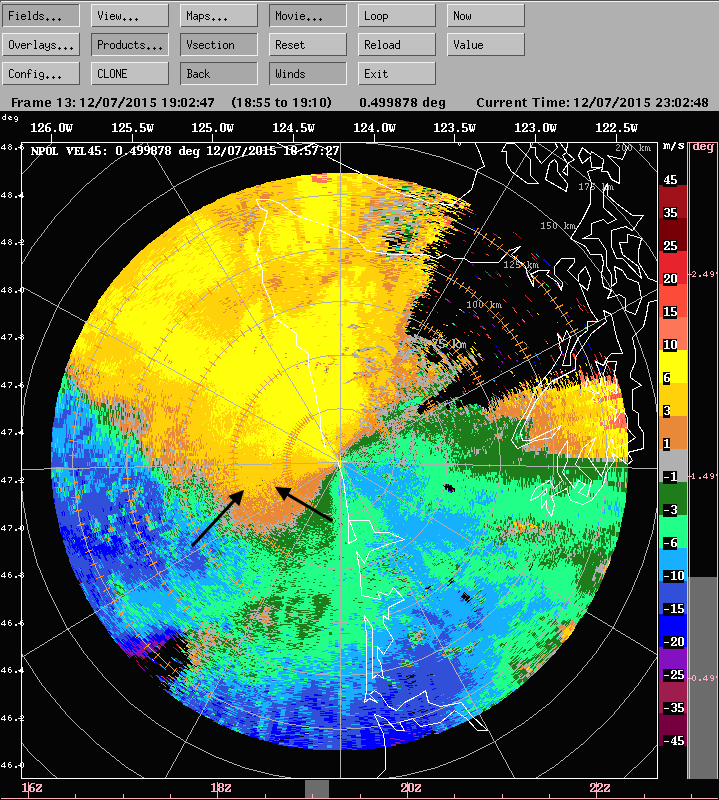
top row of Figure 7 show
echoes in the trailing portion of the first wave. A
marked north-south echo line was located west of the
radar. The radial velocity in the upper right panel
indicates a general windshift at this line. Numerous
small scale waves oriented southwest-northeast
populate much of the echo pattern. These waves are
seen also in the second wave, described below. The
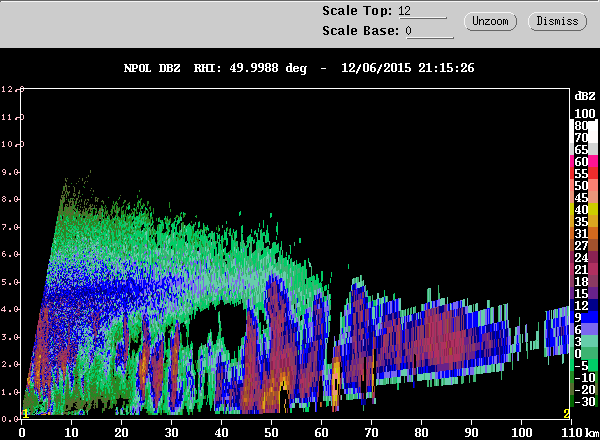
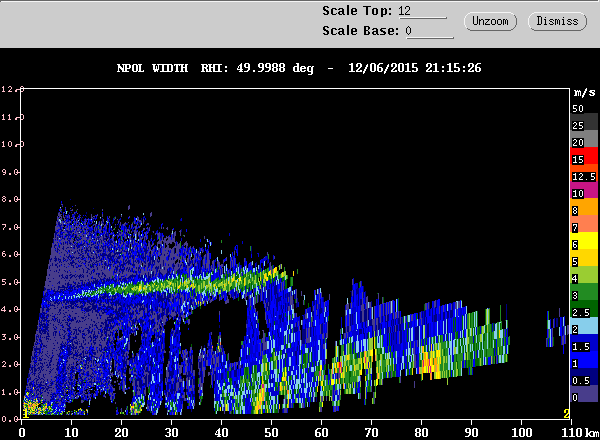
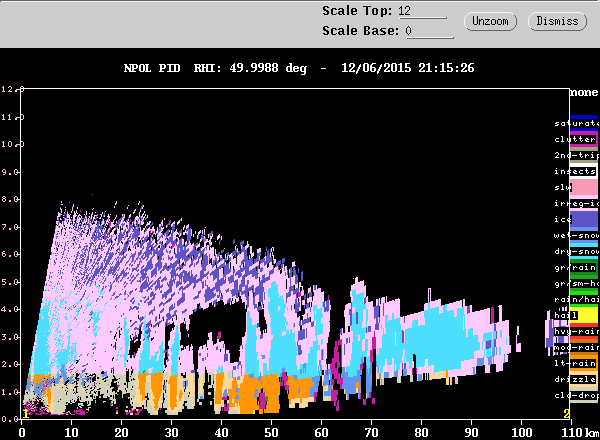
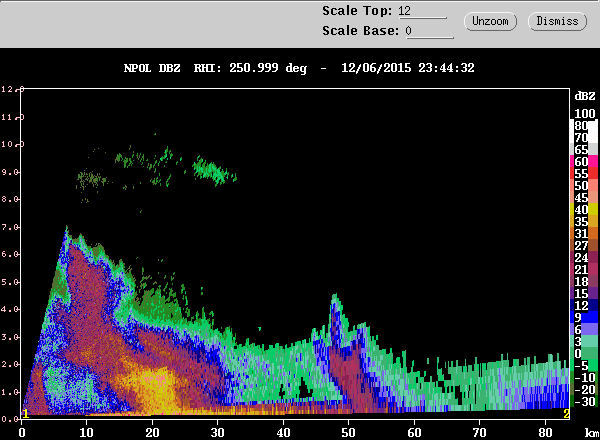
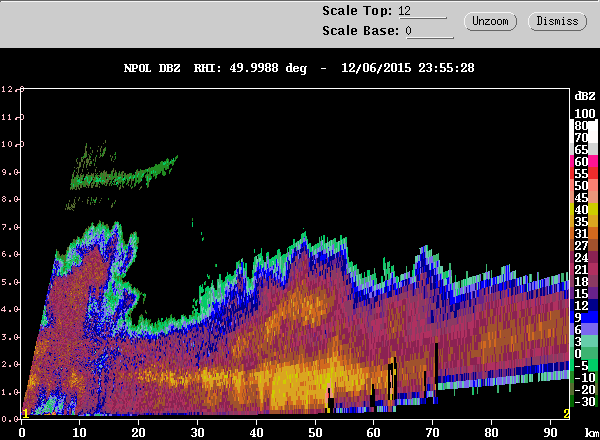
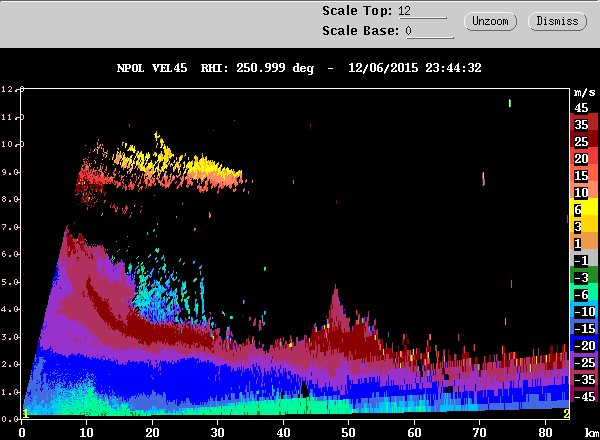
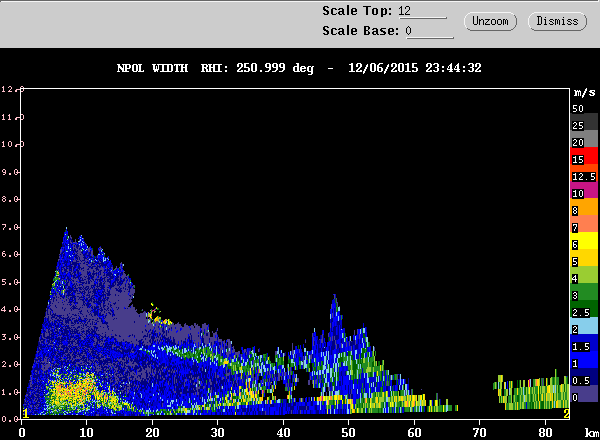
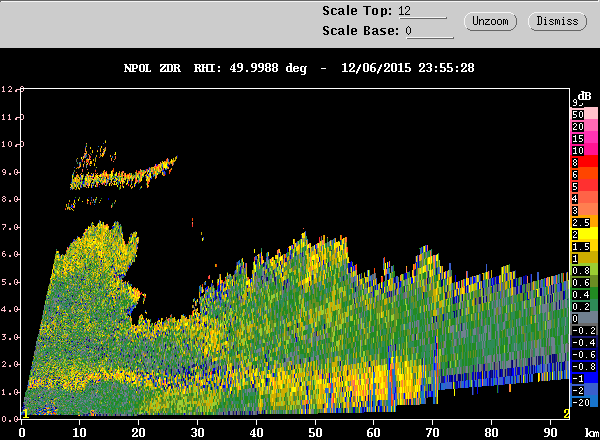
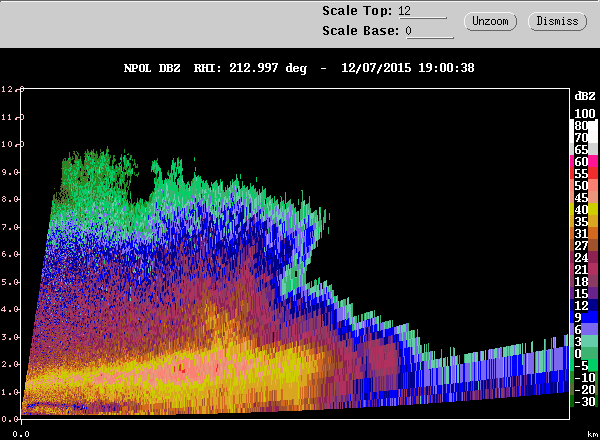
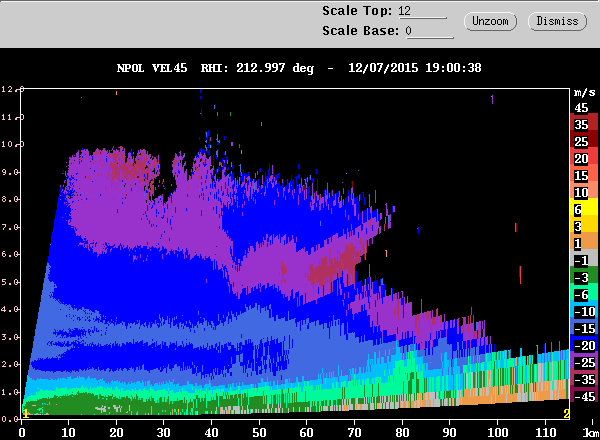
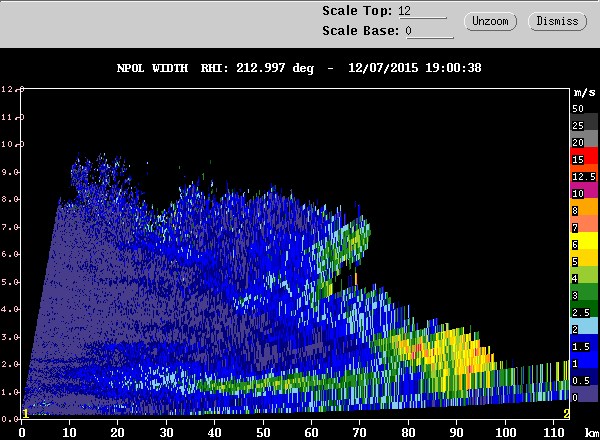
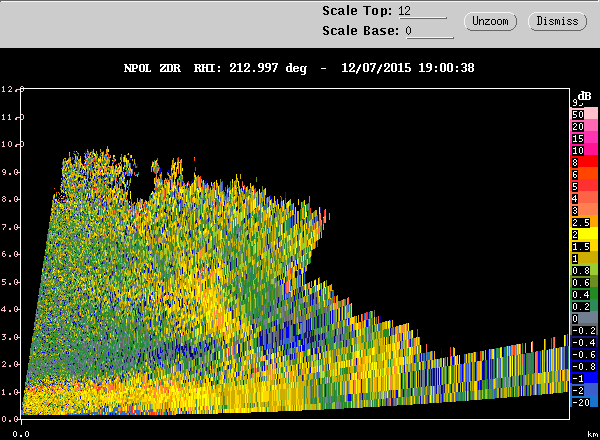
RHIs in the 2nd-5th rows of the left column of Figure 7 indicate that the
prominent echo line west of the radar was somewhat
convective in nature, reaching 7 km in height. The
spectrum width indicated that this echo was quite
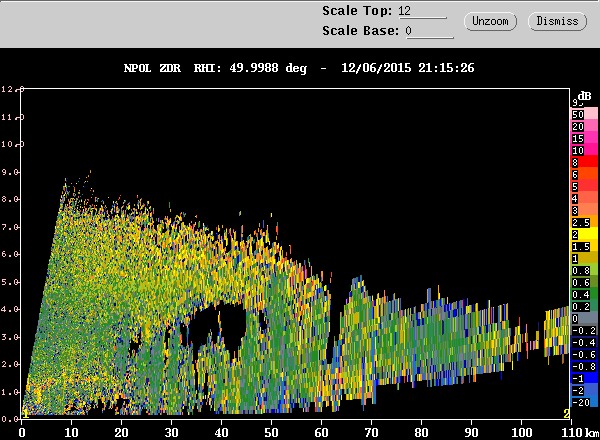
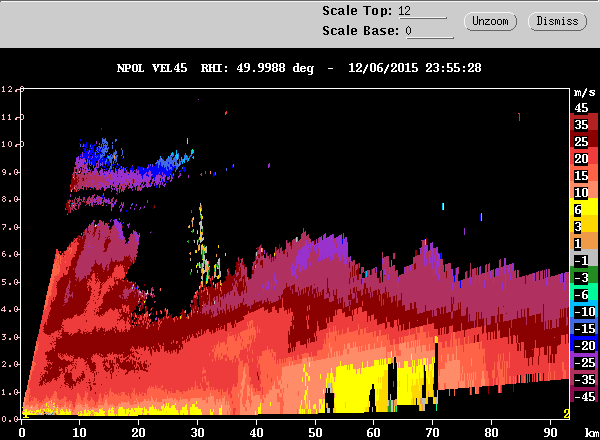
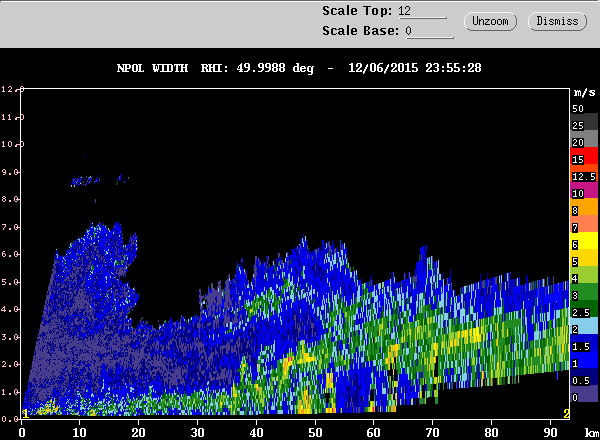
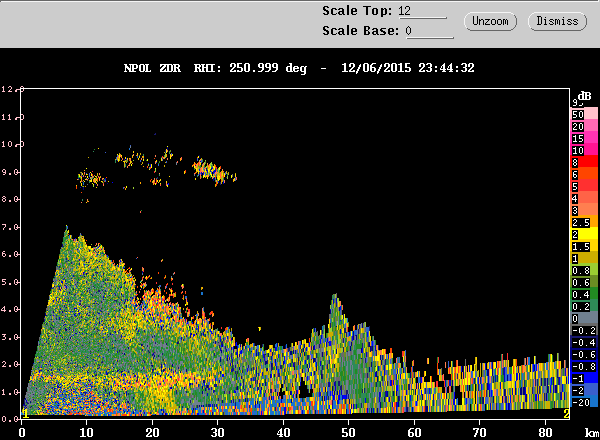
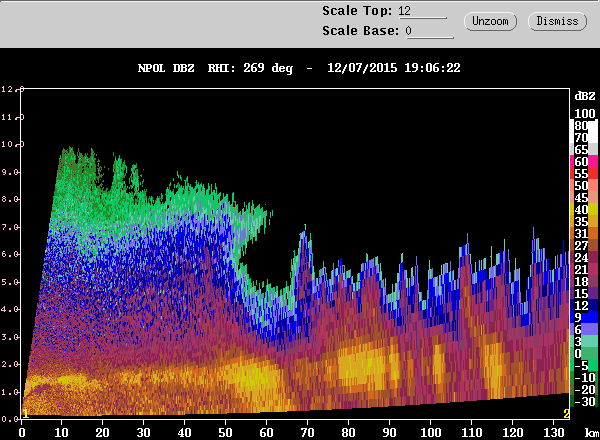
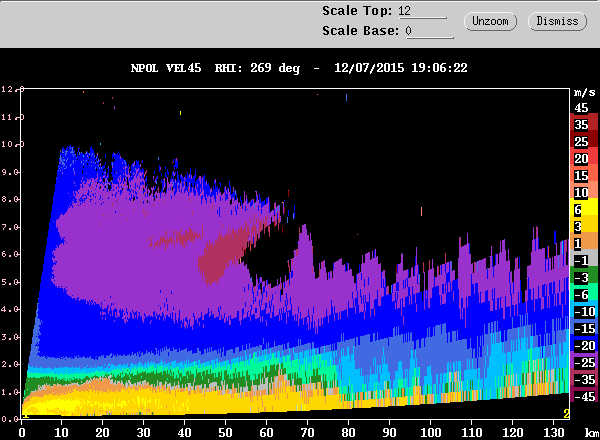
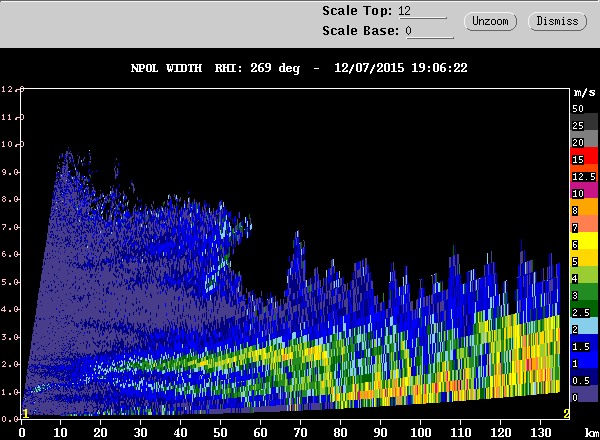
turbulent. The RHIs in
the 2nd-5th rows of the right column of Figure 7 indicate
orographic enhancement of the precipitation. The
radial velocity was being lifted over the terrain,
and the reflectivity and zdr fields indicate
enhanced microphysics in response to the lifting.
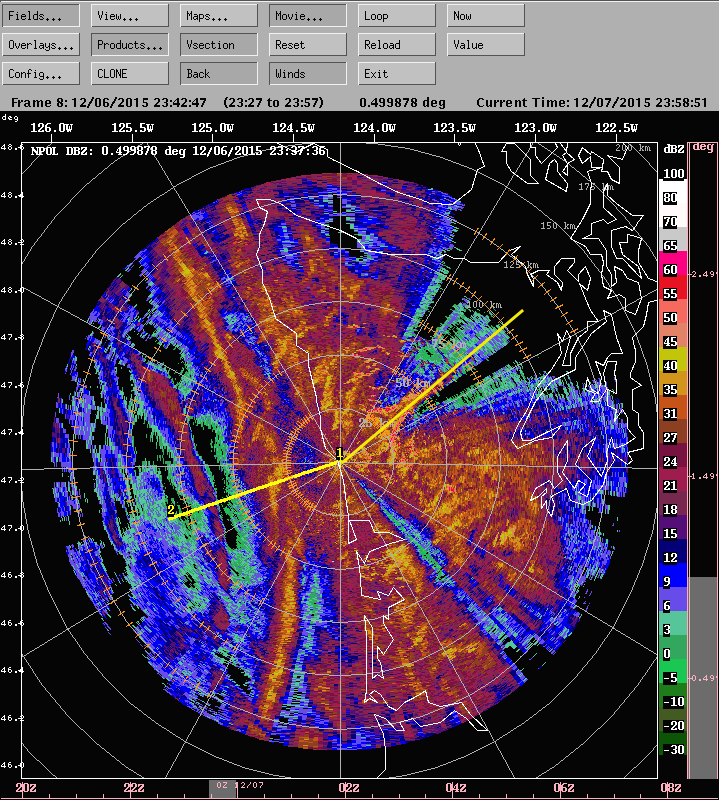
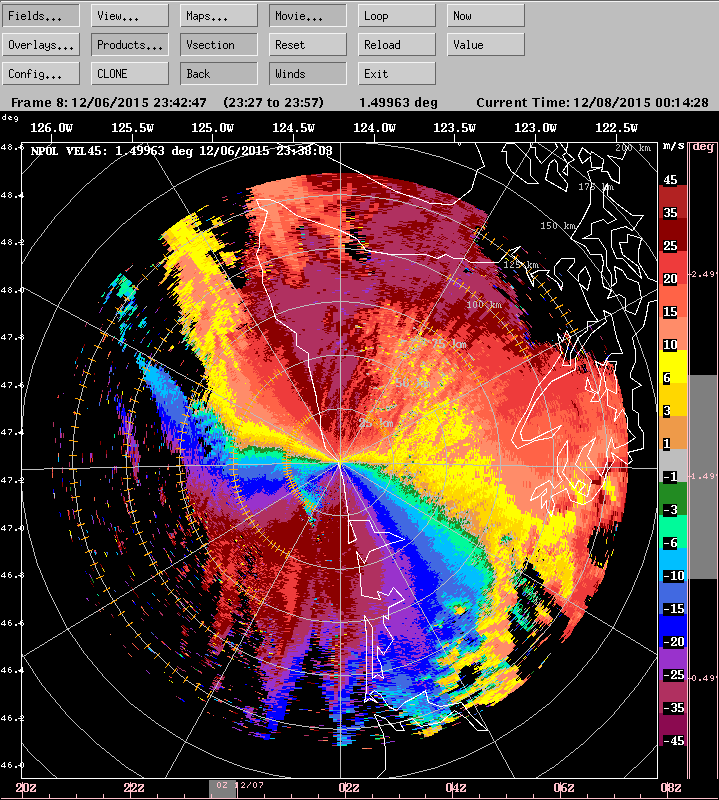
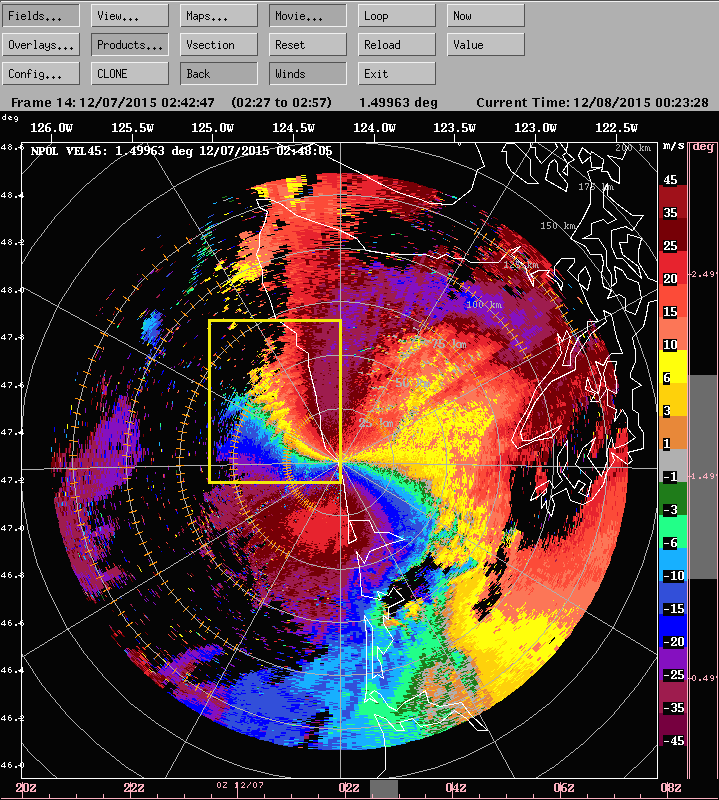
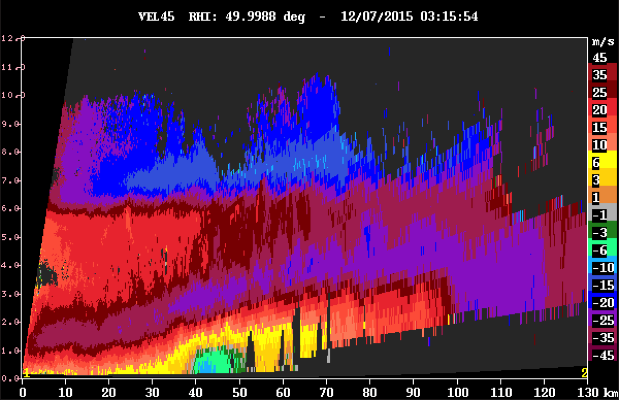
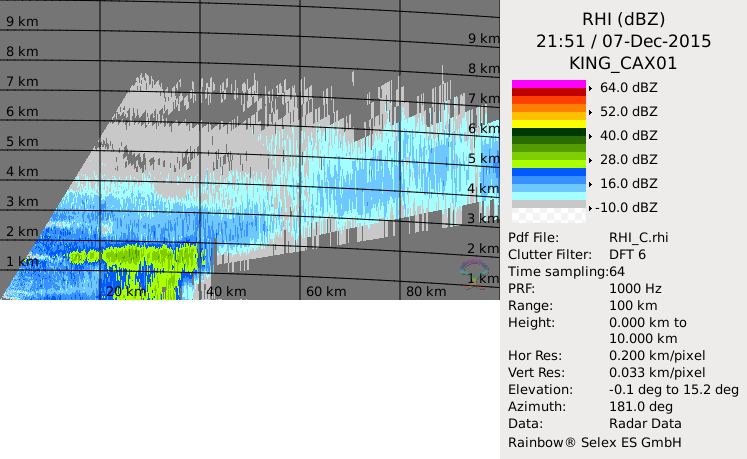
Figure 8 shows a further
example of the small scale waves superimposed on
the echo pattern (inside the yellow box), and Figure 9 shows a
further example of the lifting of the maximum wind
layer ahead of and over the sloping terrain.
Figure 10 shows
examples of the dual-polarimetric radar echo in
the second wave. The PPIs in the top row of Figure 10 show an
intersection of a north-south oriented mesoscale
rainband with an east-west band and a wind shift
from southeasterly to southwesterly at the
intersection of the lines. The RHIs in the lower
panels show that the echo to the south of the east
west line was stratiform with a strong bright band
and convective to the west of the north-south
line. The radial velocity RHI in the right column
shows a sharp wind shift at the north-south line.
The ZDR RHI in the stratiform band (left column)
shows enhancement of the ice processes in the 4-5
km layer. The radial velocity PPI in Figure 11 shows another
example of the wavelike bands along the southern
fringe of the echo.
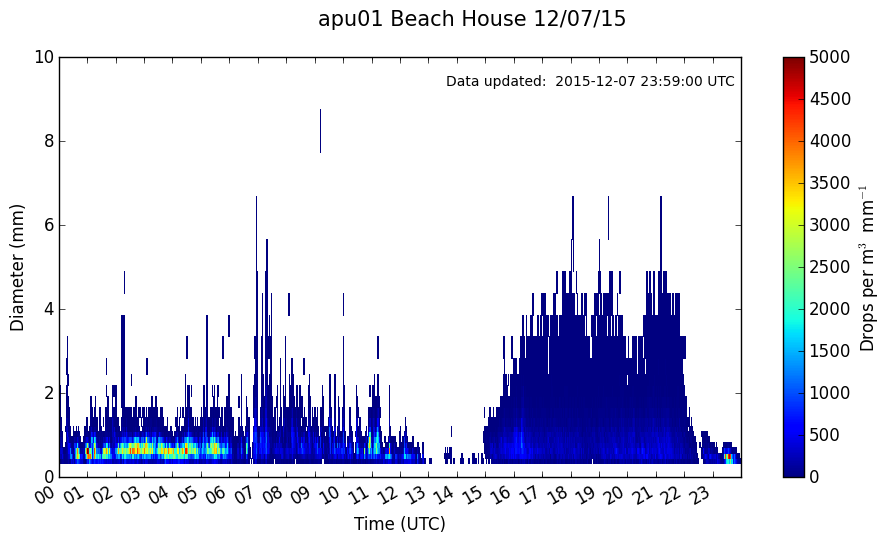
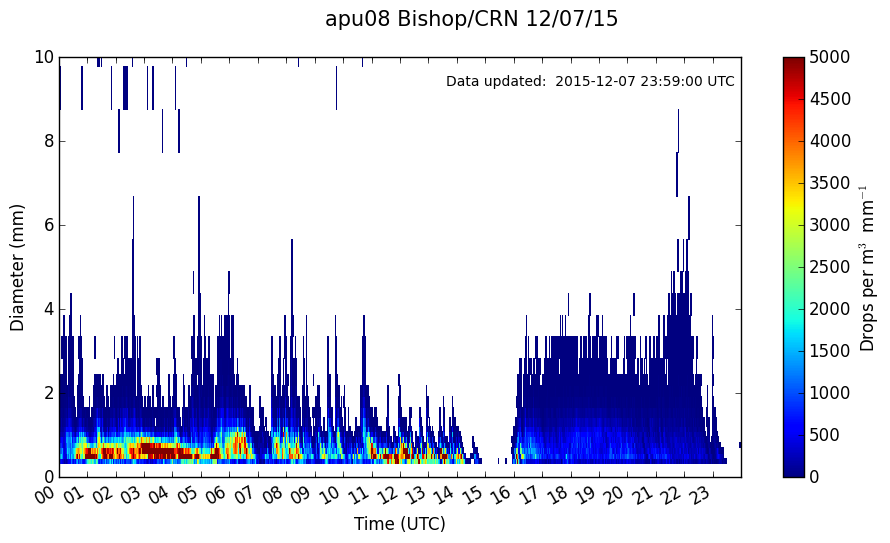
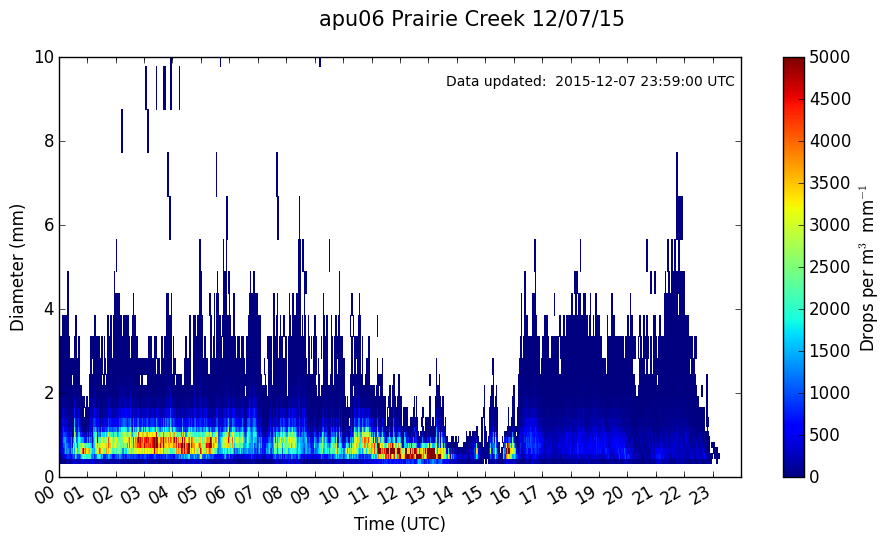
The particles size distributions differed sharply
between the two waves (Figure 12).
The first wave had distributions sharply peaked in
the small drop sizes, probably associated with low
level growth in the orographically enhanced
lifting seen in the radial velocity RHIs of Figure
7 and Figure
9. The
second wave had the broader, unpeaked
distributions that we have come to associate with
drop distributions associated with melted ice.
Such distributions would be consistent with the
highly stratiform echo seen in the left column of
Figure
10. The
Environment Canada X-band radar show deep layers
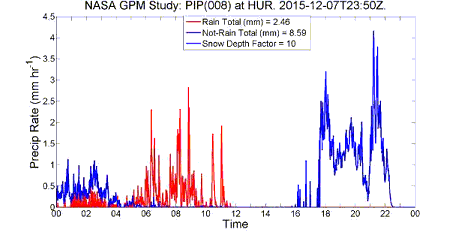
of snow over Hurricane Ridge in both waves (Figure 13). However the
precipitation data collected by the PIP at
Hurricane Ridge (Figure 14)
indicated that the precipitation was in the form
of rain during the latter period of the first
wave. MRR data (not shown) indicate that the snow
was melting in the lowest 100 m above the site.
|