An occluded
front rapidly propagated through the OLYMPEX domain
early in the day on 10 December. An extended period of
post-frontal convection then rapidly developed and was
sustained for most of the day. This is the best
example of post-frontal convection observed during
OLYMPEX to date. All three aircraft and radars were
successfully deployed during this event. Most of the
ground instruments were functional.
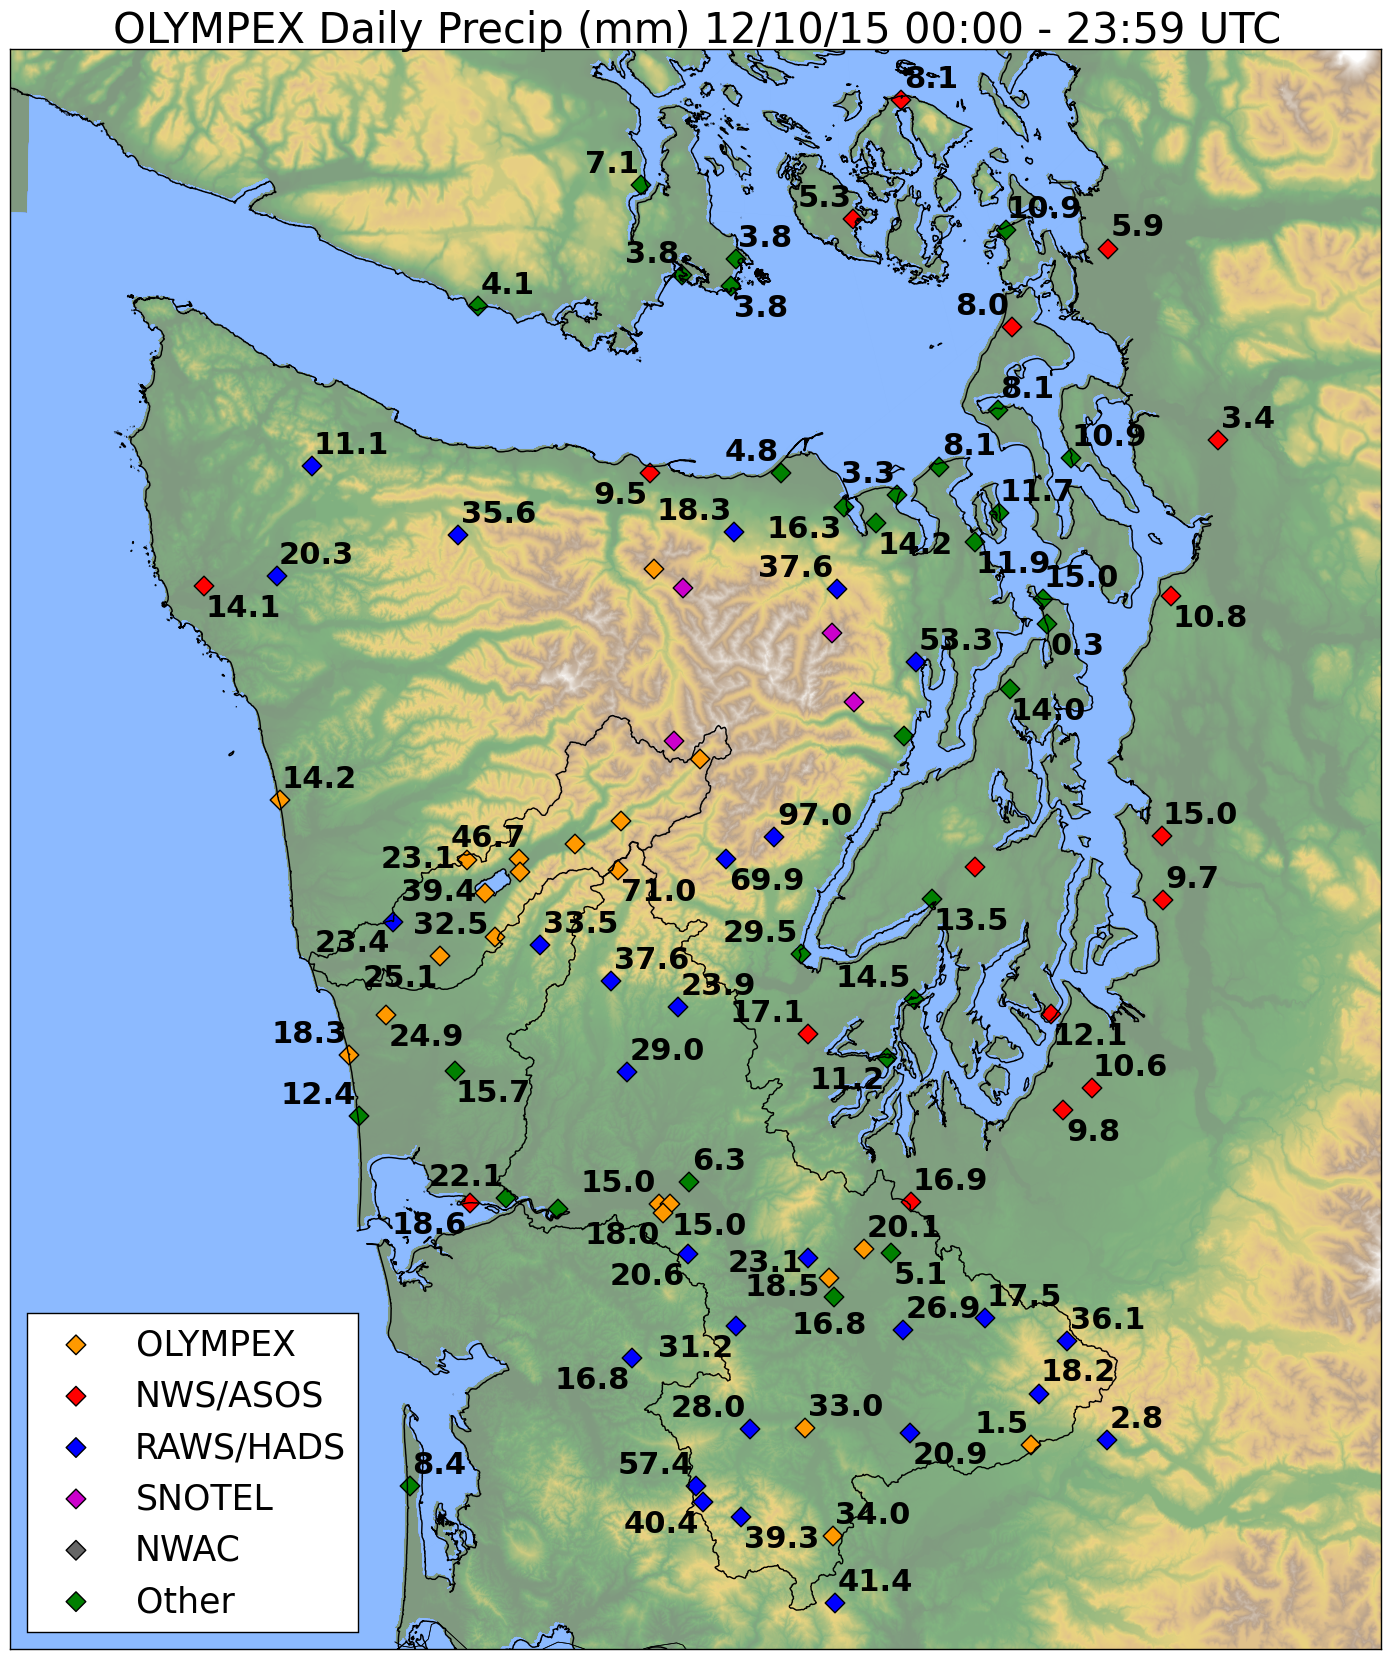
Precipitation accumulations for today show notable
orographic enhancement with the high terrain observing
2-3 times as much precipitation as the coast (Figure 1).
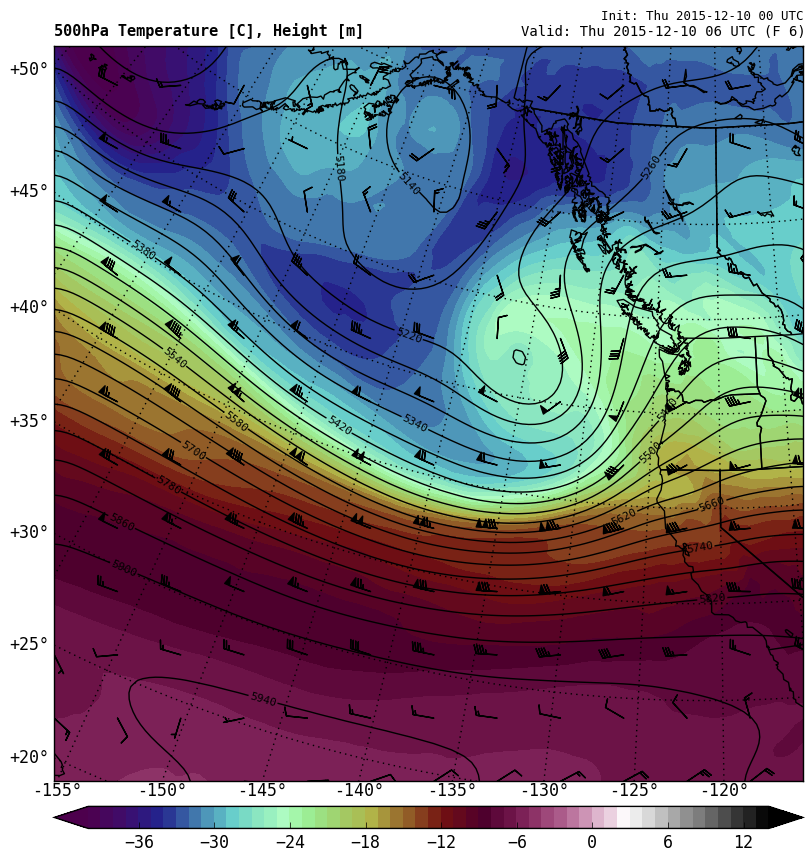
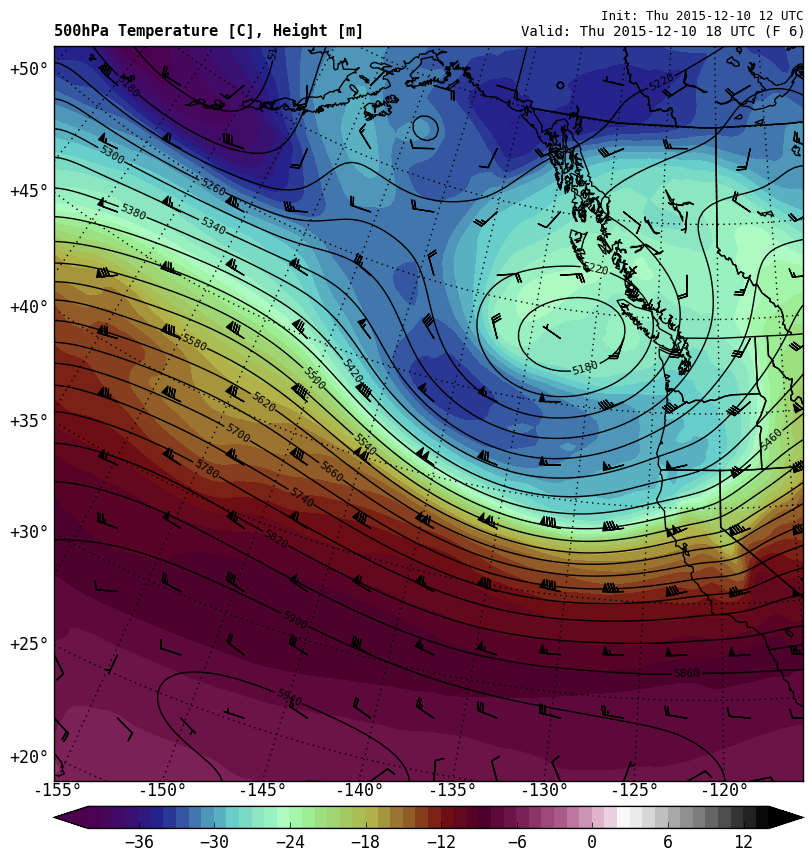
Using terminology coined by the National Weather
Service in Seattle, the stampede of shortwaves
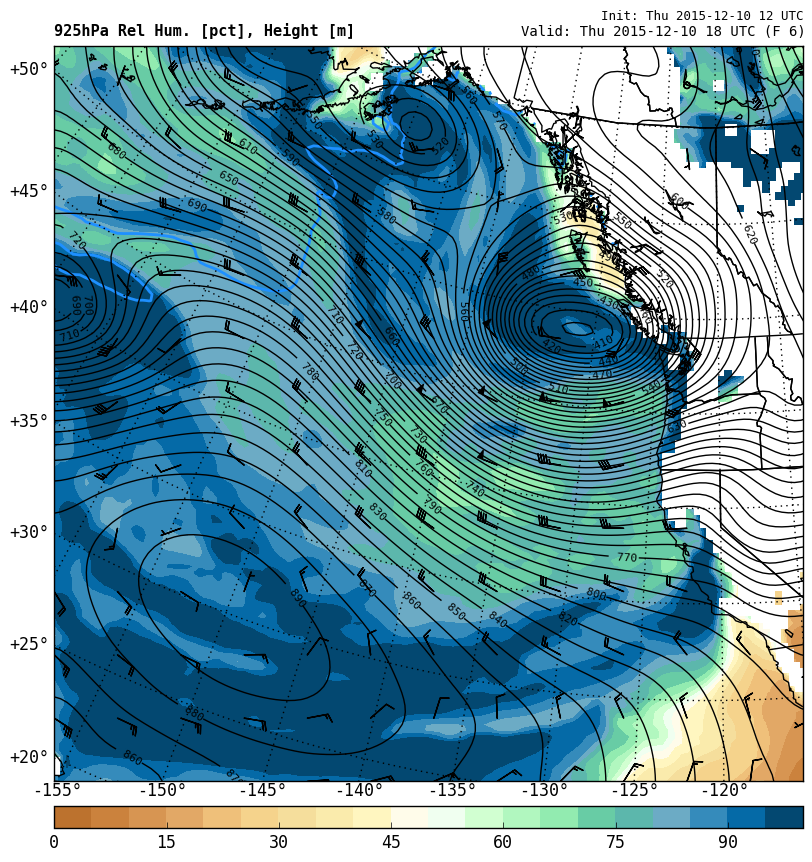
continued today. The top row of Figure
2 shows that the current shortwave is associated
with a cutoff low at 500 hPa. This cutoff low moved
slightly towards the northeast throughout the day and
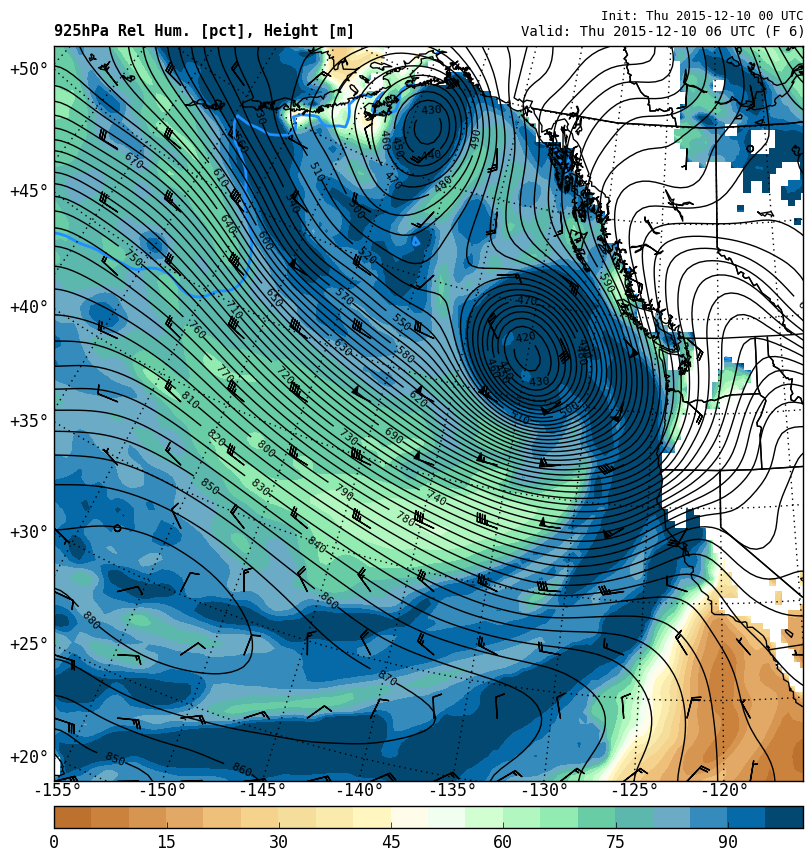
wrapped in cold air behind it. While it was moist at
925 hPa during the passage of the occluded front, the
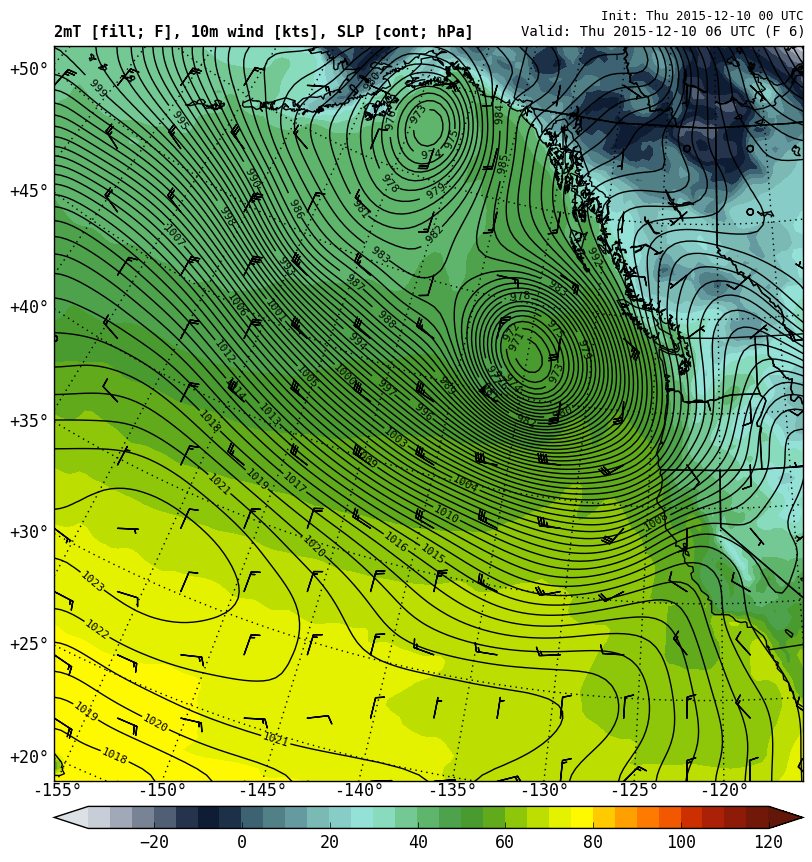
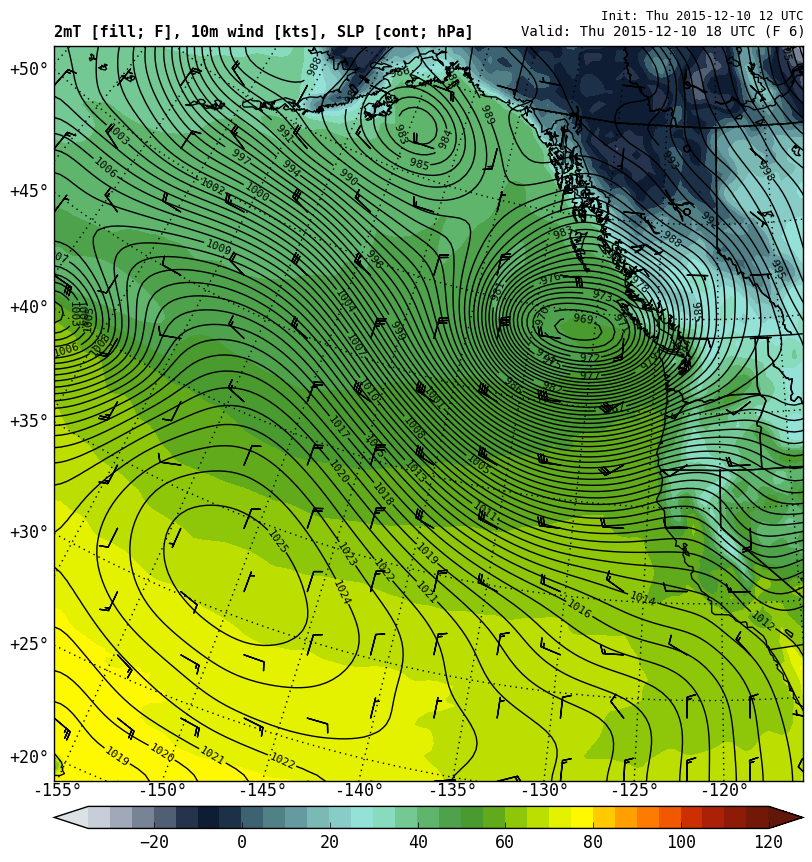
atmosphere dried by 1800 UTC (middle row of Figure 2). At the surface
a very weak temperature gradient was observed at 0600
UTC in association with the occluded front (bottom row
of Figure 2). By 1800 UTC the
surface low pressure was center just off Vancouver
Island, British Columbia. At all levels, winds
transitioned from southwesterly to westerly as the low
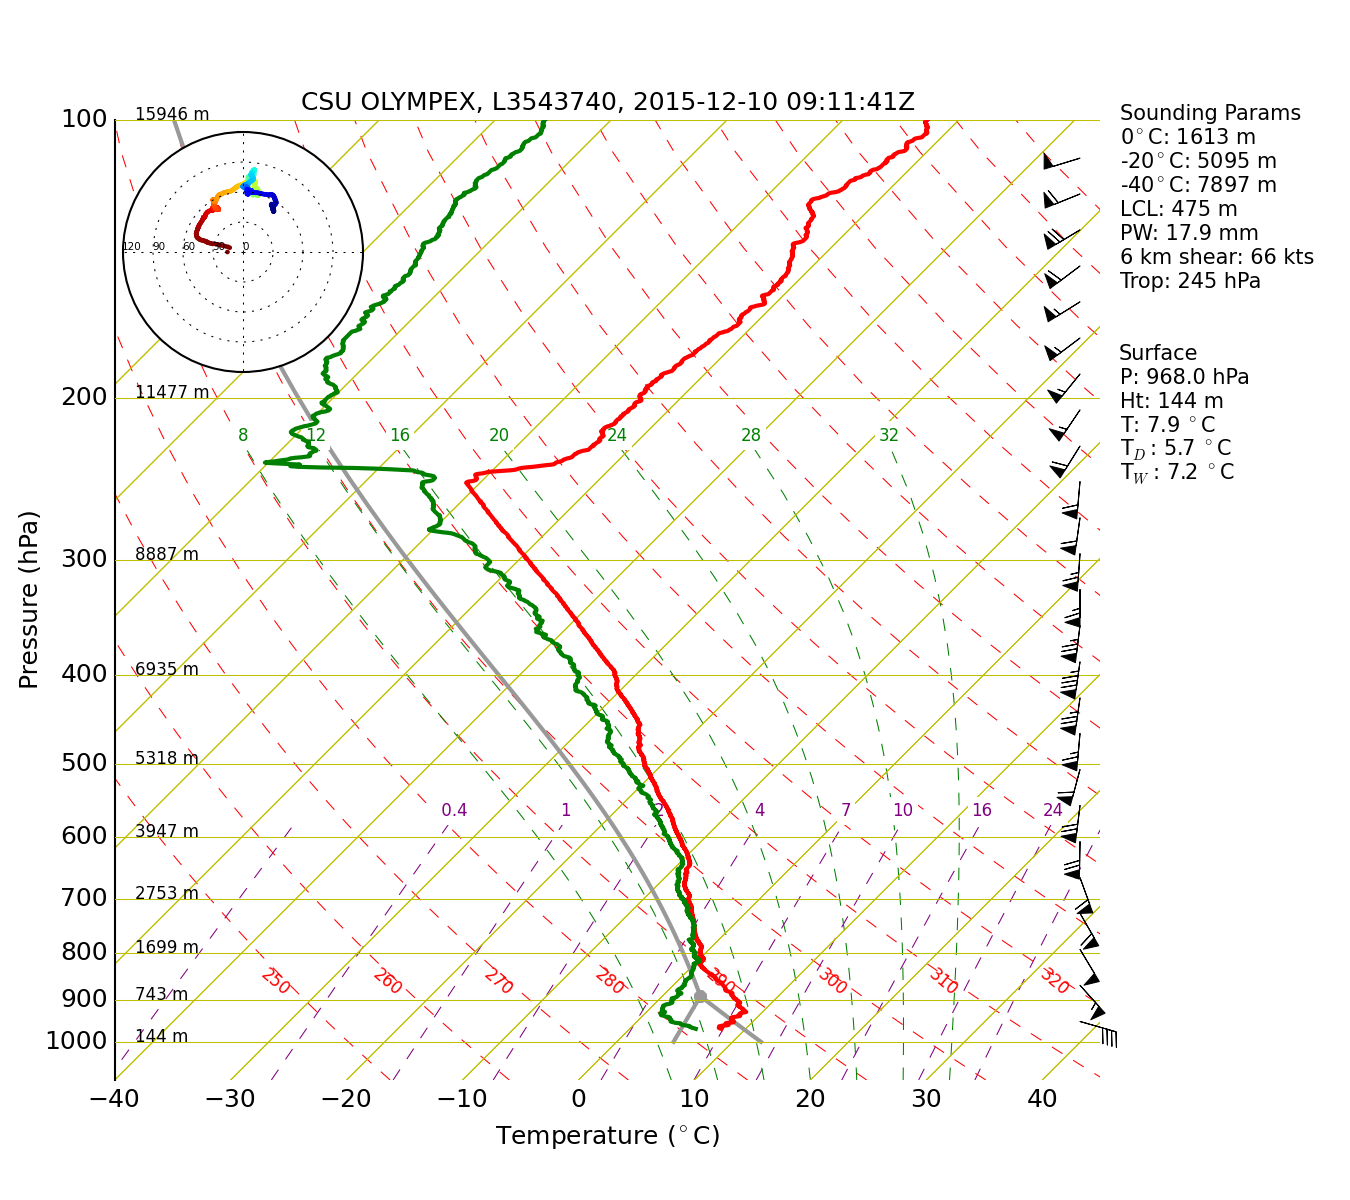
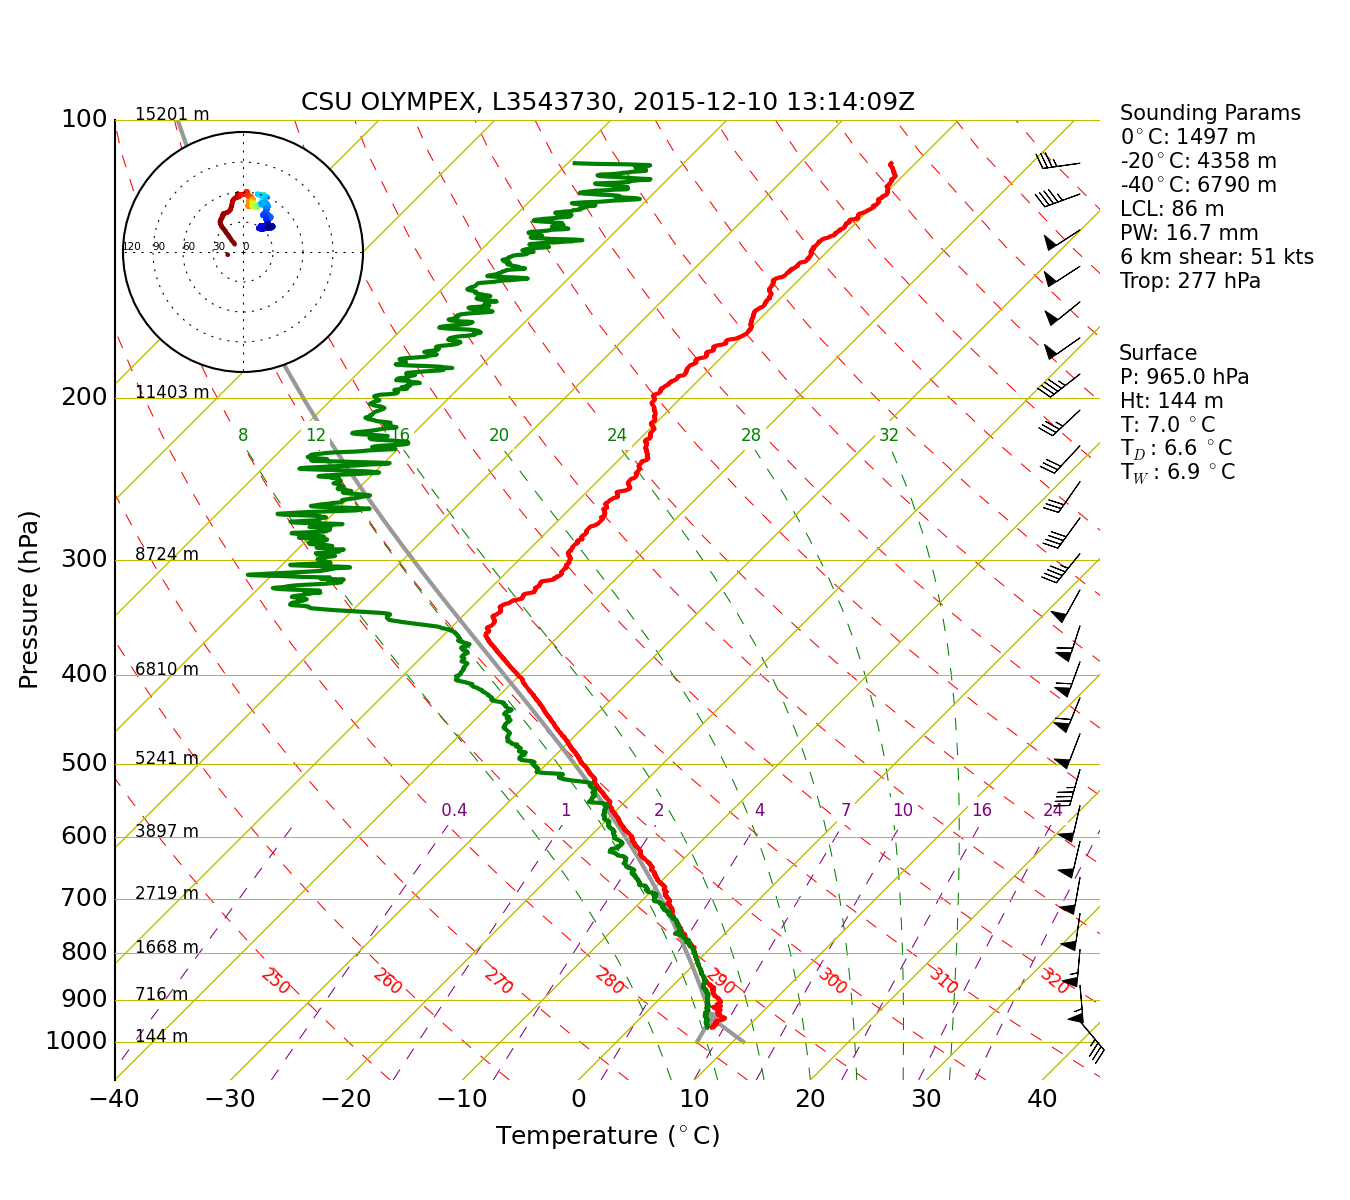
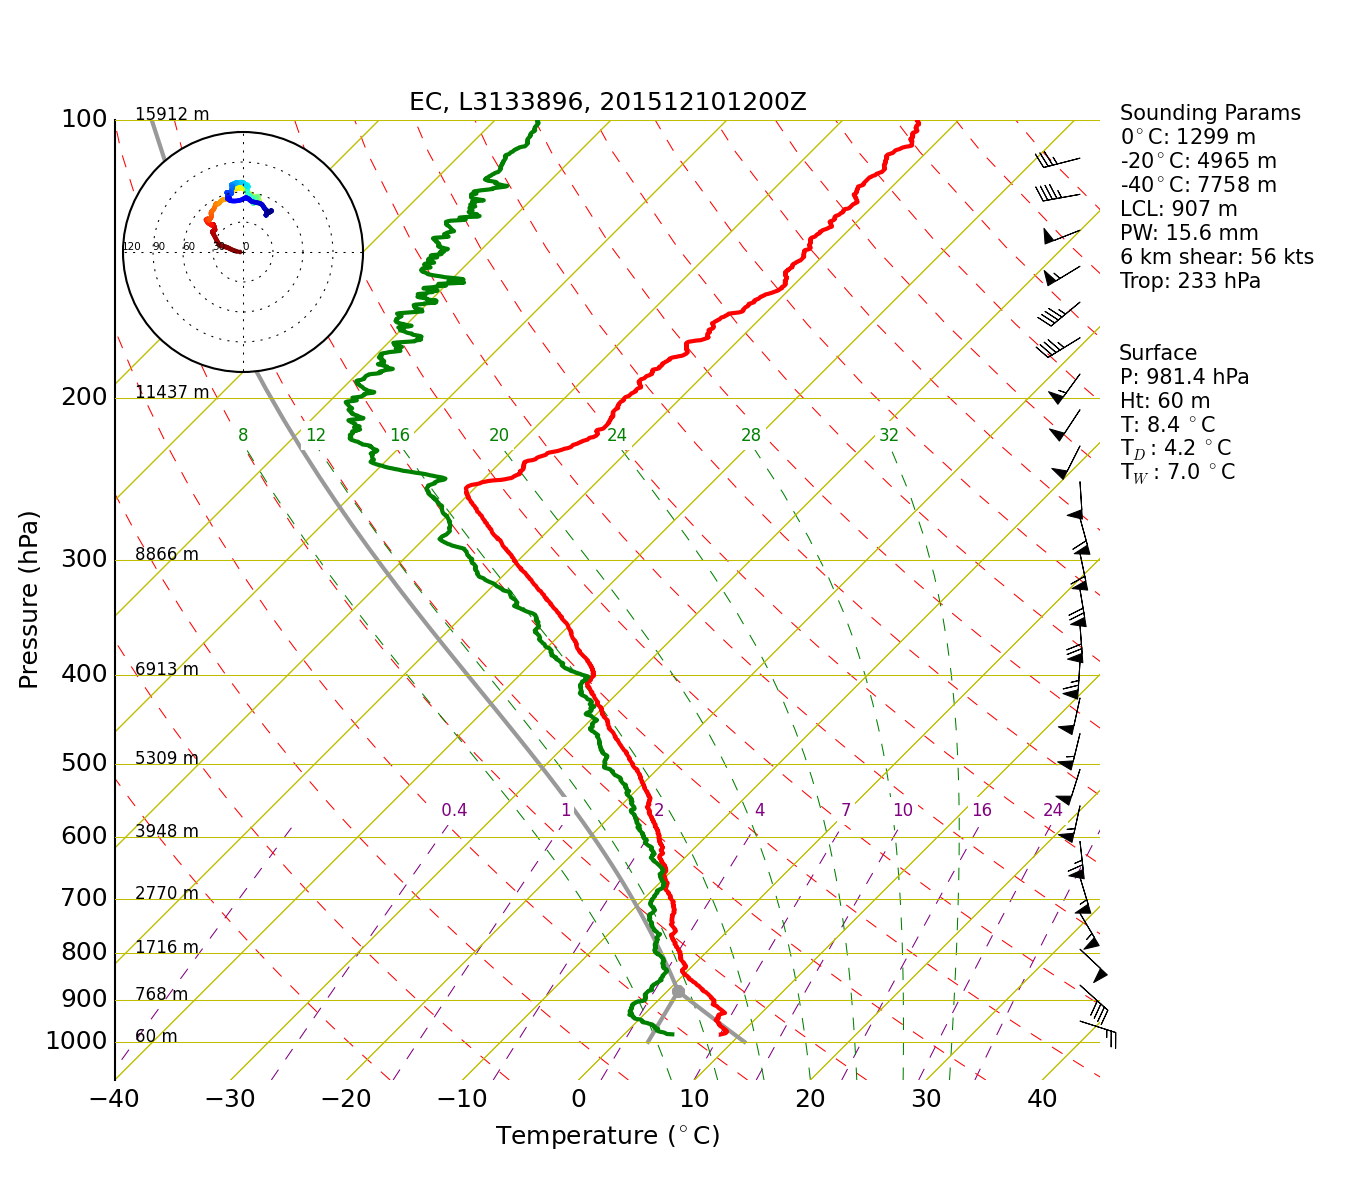
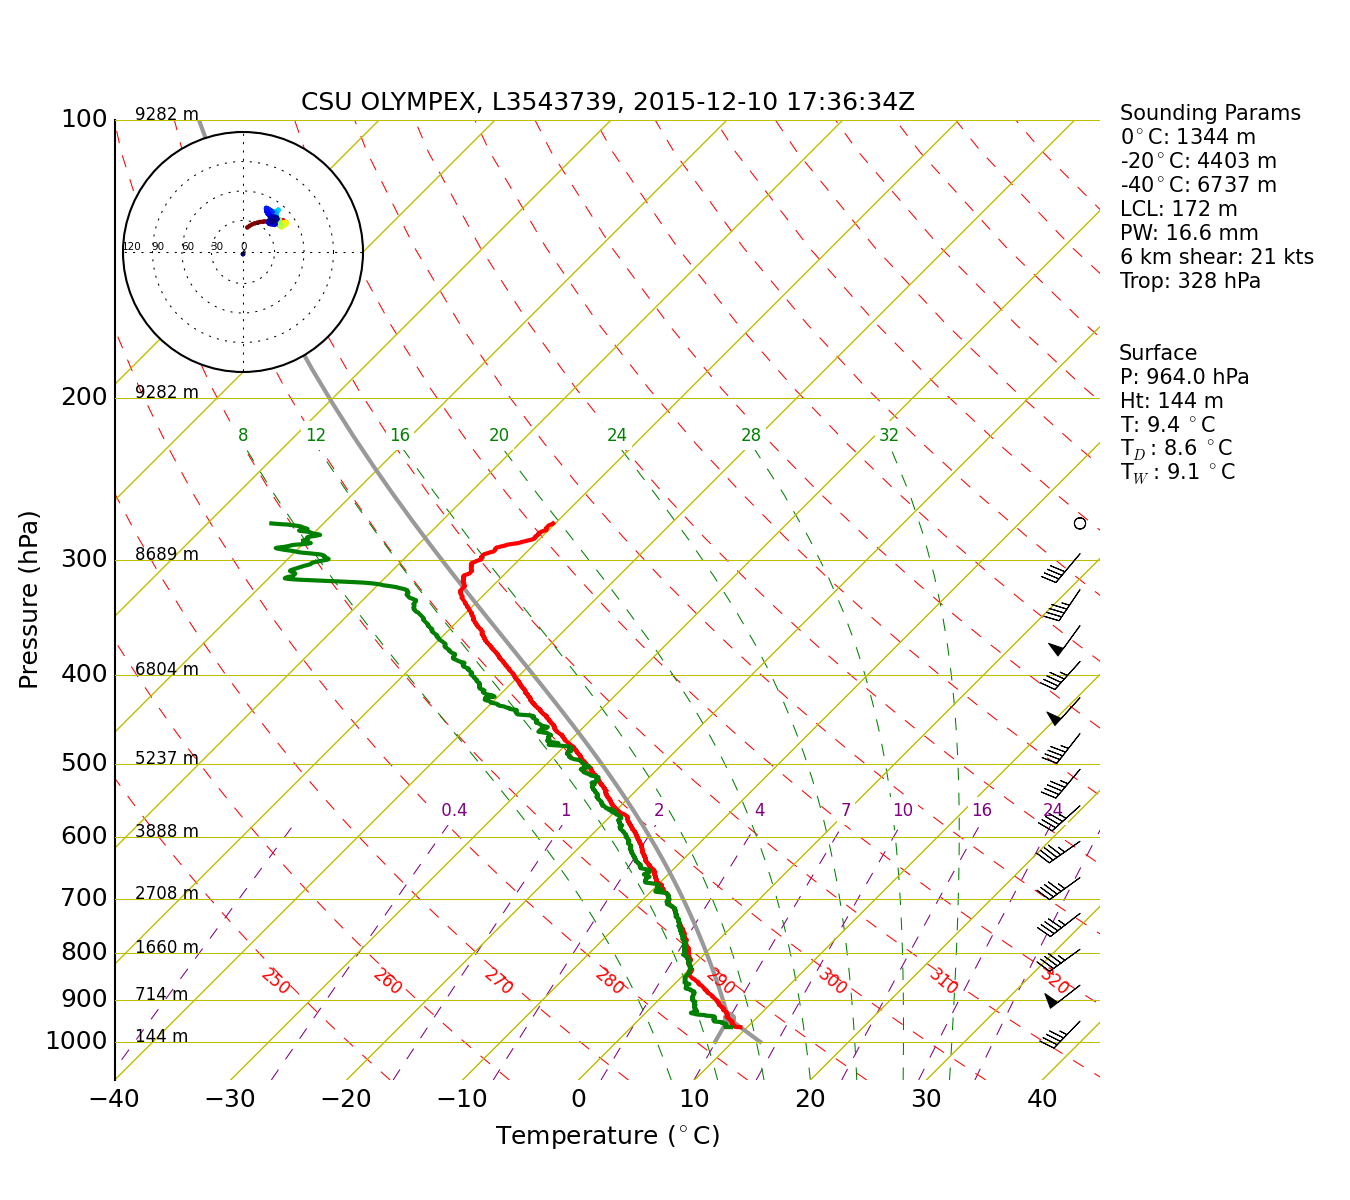
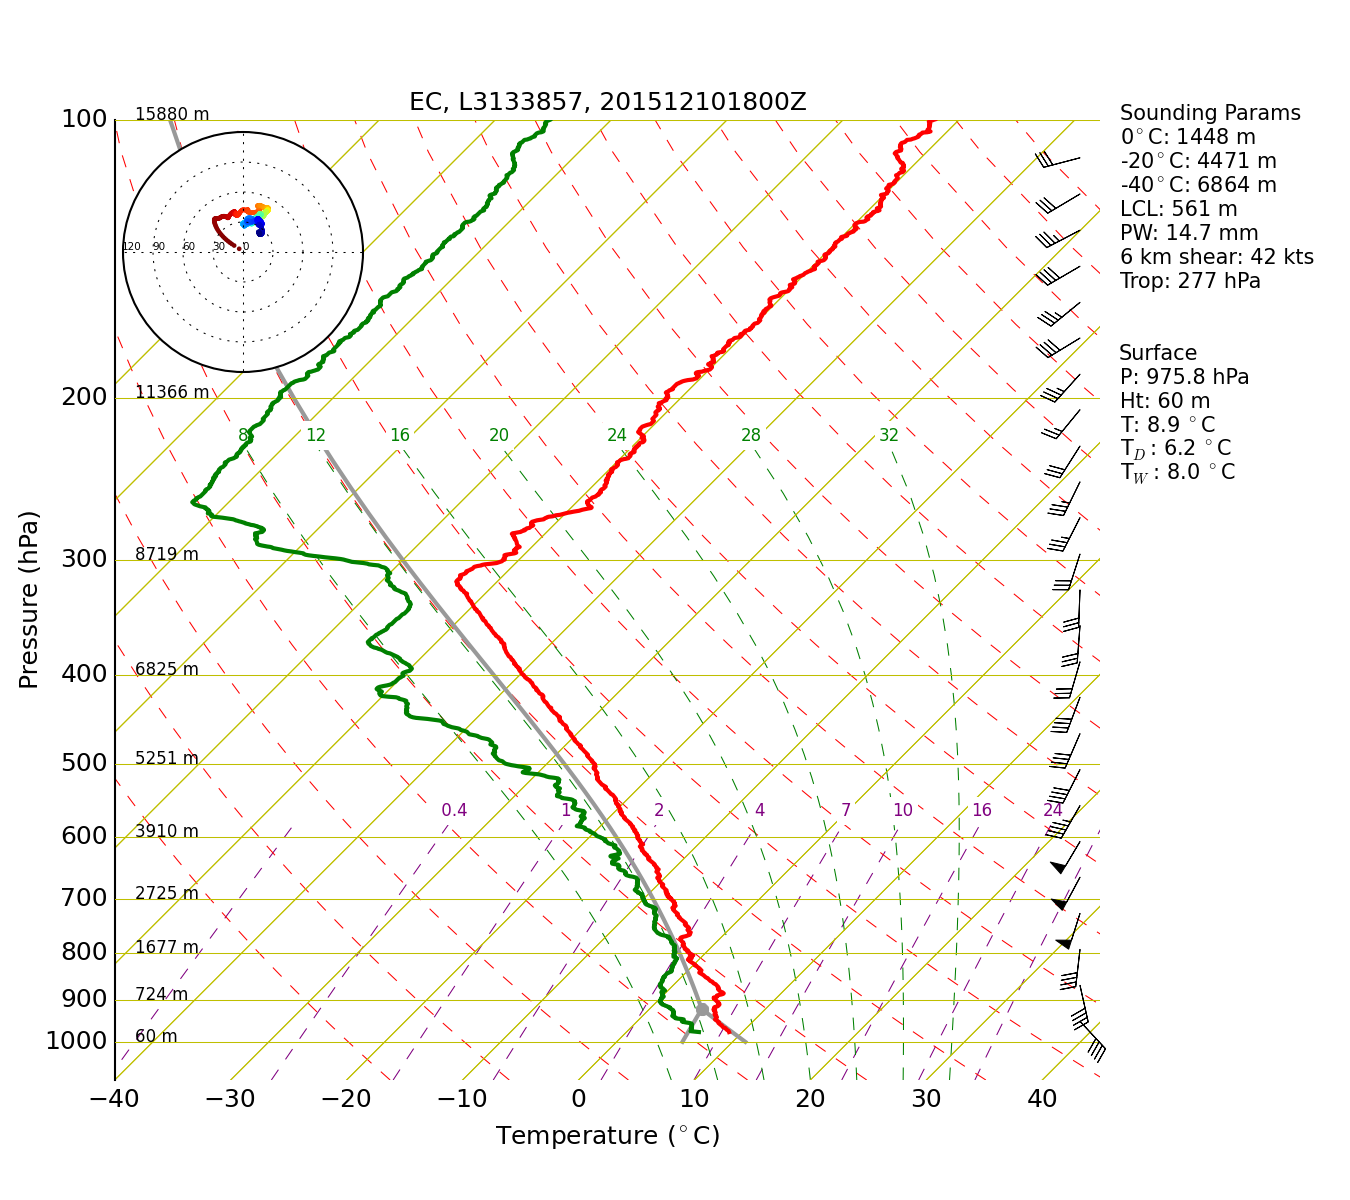
moved northeastward. Soundings taken in Victoria,
British Columbia, and NPOL indicate that low-level
winds were initially backing, suggesting cold air
advection (Figure 3).
However, as the post-front convection developed both
locations had weakly veering low-level wind suggesting
warm air advection. Additionally, both locations
observed a large drop in the tropopause following the
occluded front as cold air wrapped around the low
pressure center. In general, soundings in Victoria
were drier than soundings at NPOL, especially below
800 hPa.
Infrared satellite imagery in Figure
4 shows that cold cloud tops associated with the
occluded front became increasingly meridionally
extended and colder as the system propagated into the
Pacific Northwest. The coldest cloud top temperatures
were located for the OLYMPEX domain at approximately
0900 UTC 10 December. The post-frontal convection
immediately followed the occluded front and the
convective elements seen in the IR imagery became
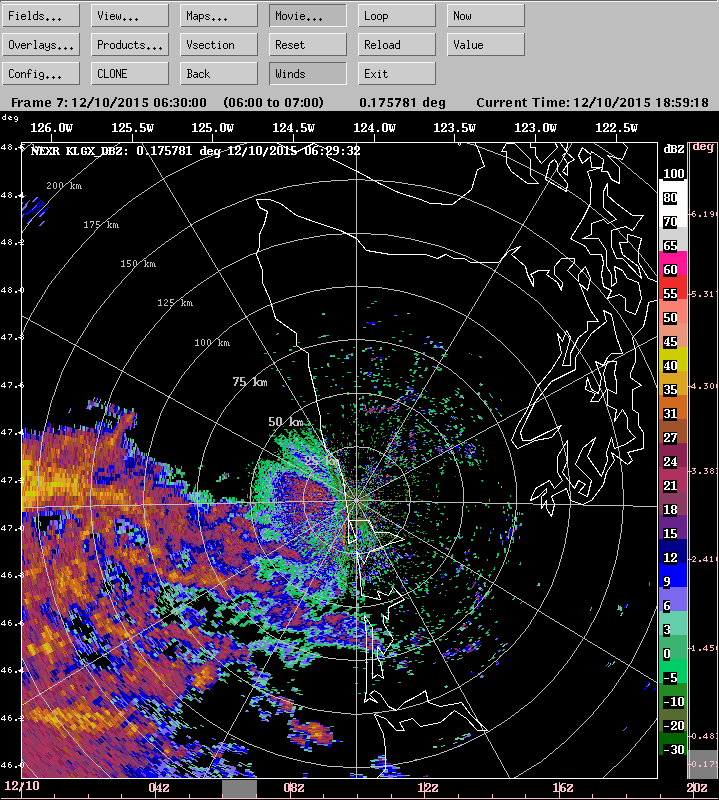
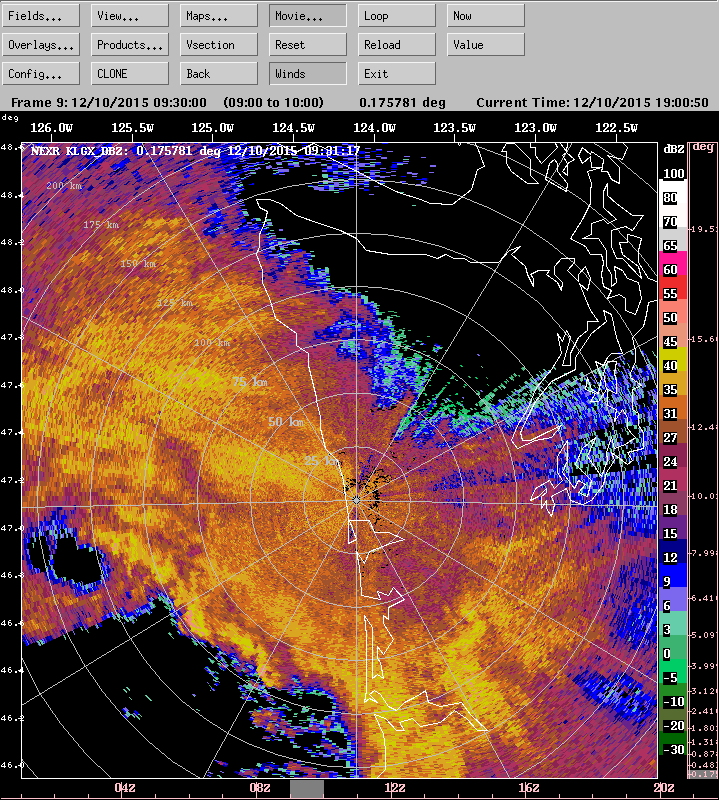
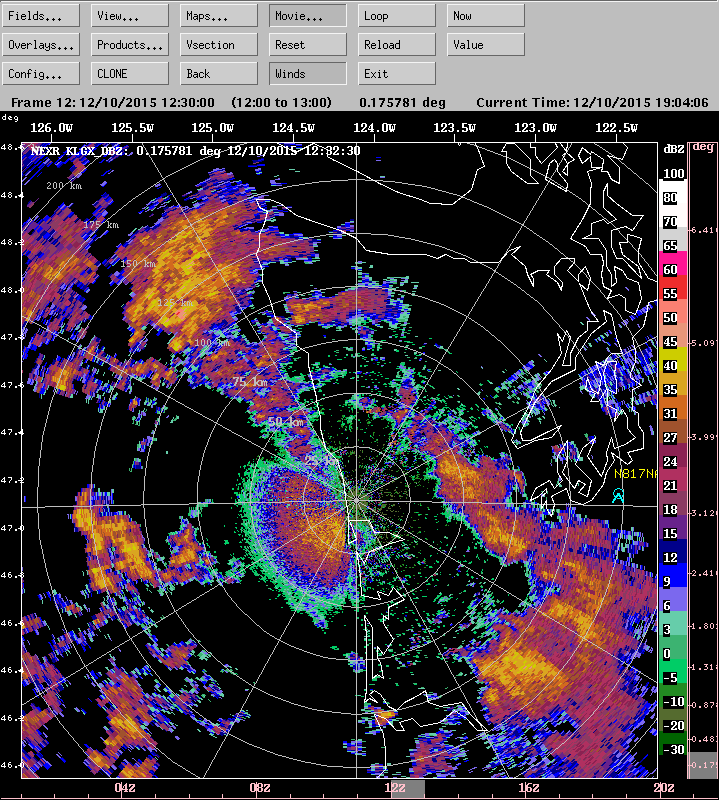
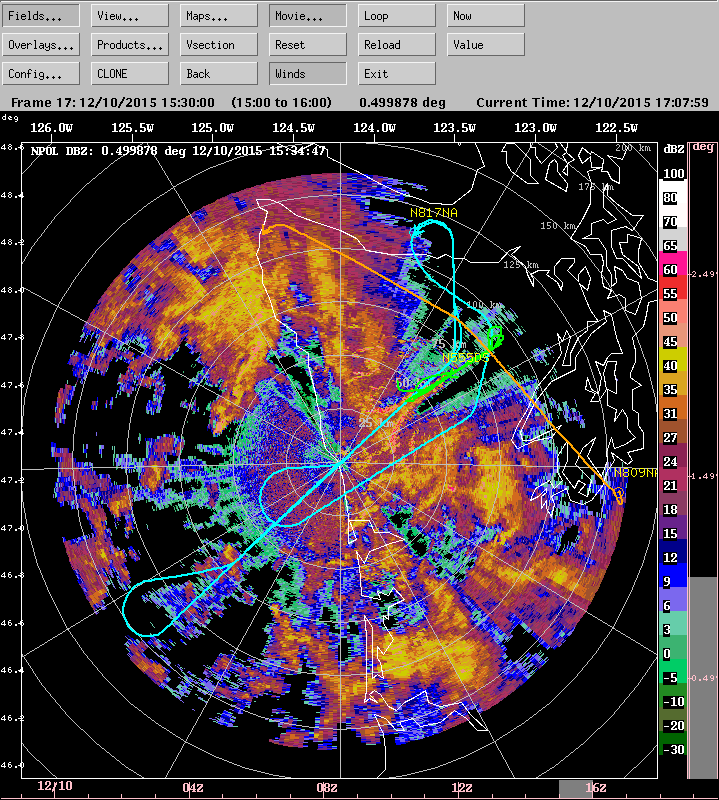
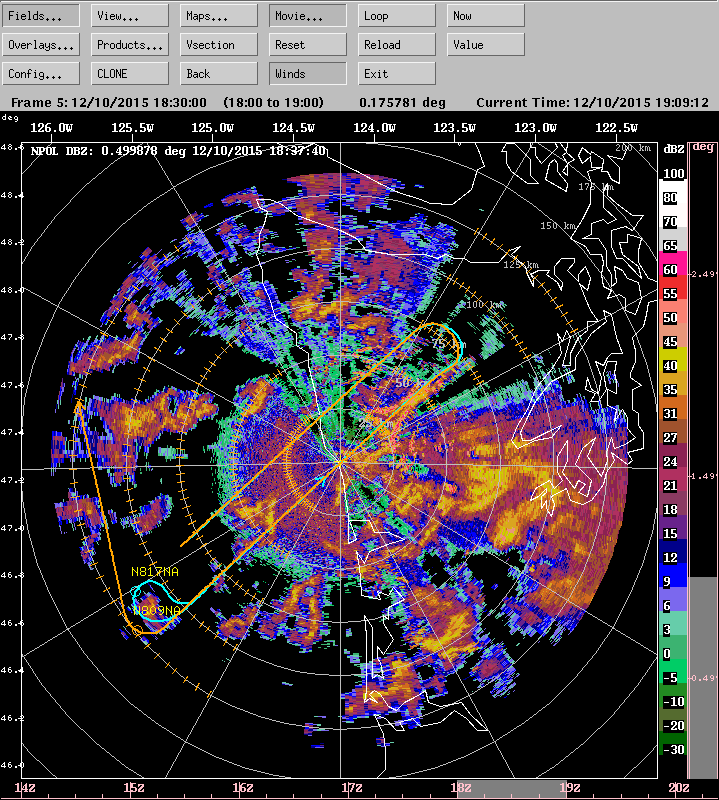
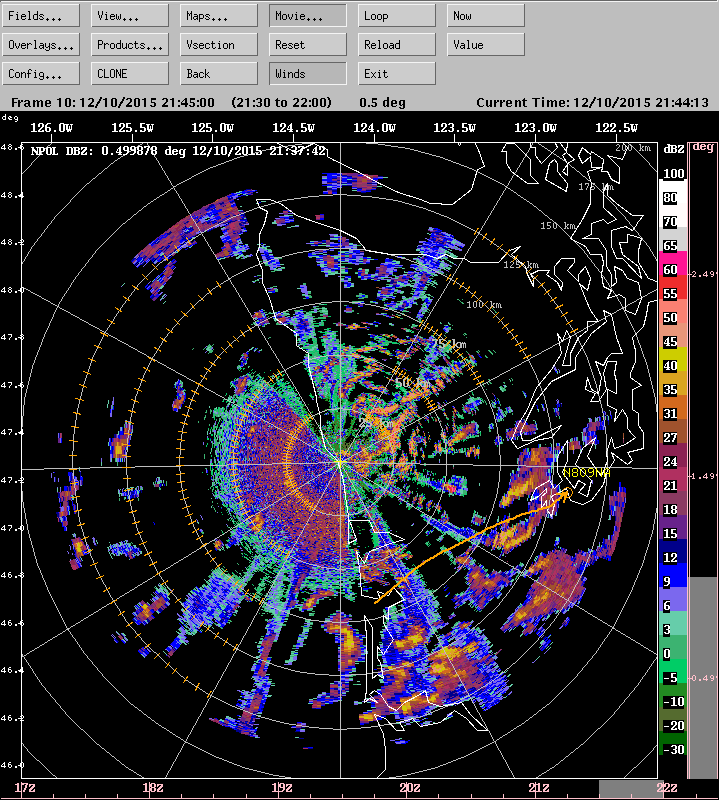
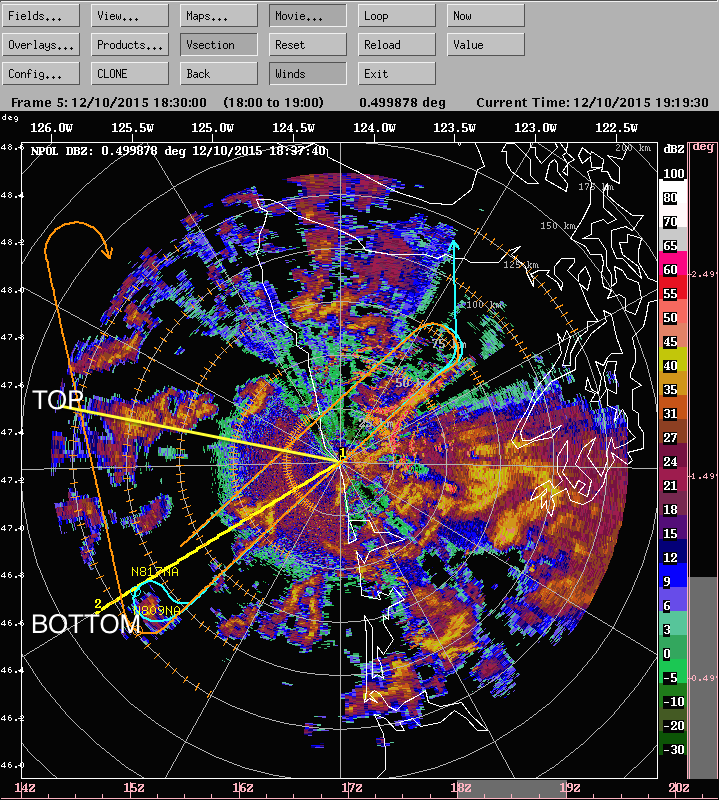
colder and larger throughout the day. Figure 5 shows a time sequence of
the Langley Hill and NPOL radar PPIs with the DC-8,
ER-2, and Citation flight paths overlaid. A band of
stratiform precipitation propagated northeastward in
association with the occluded front between 0700 and
1100 UTC (top middle panel of Figure
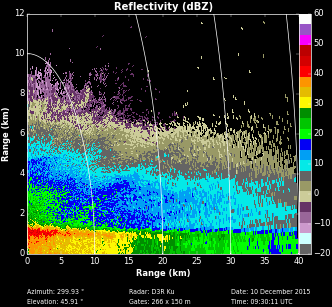
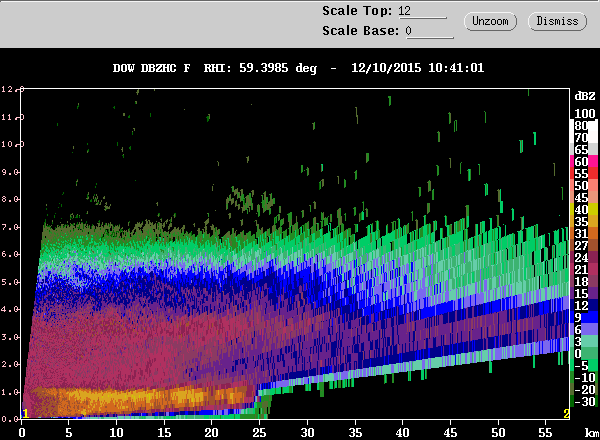
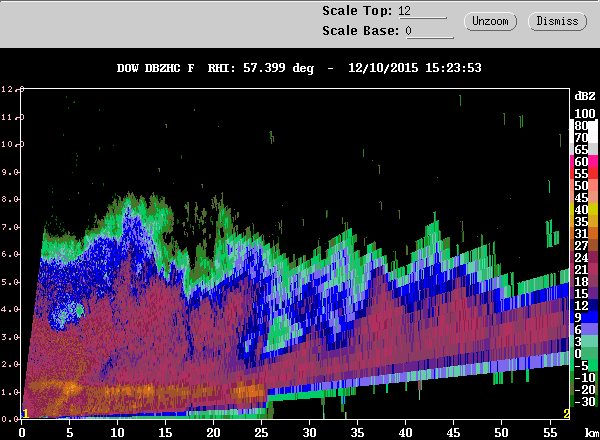
5). Figure 6 shows that
both the D3R and DOW radars observed deep stratiform
precipitation with a strong brightband near 1 km.
Unlike many of our previous stratiform precipitation
events, the DOW radar indicated that this stratiform
precipitation was associated with differential
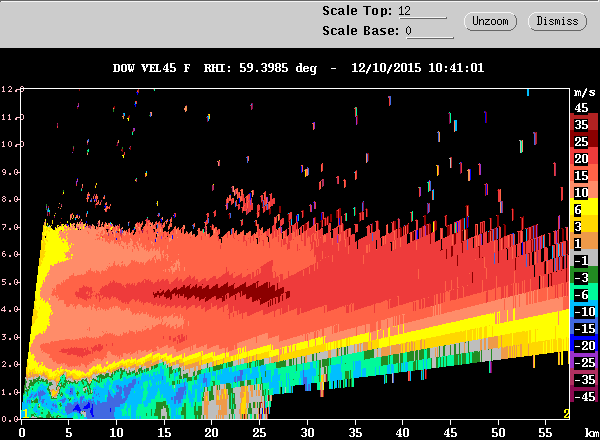
reflectivities near 0 dBZ. A
deep layer of easterly-component flow was
observed during the occluded frontal passage. The
overriding westerly-component flow was separated from
the low-level easterly-component flow by strong shear
and was rising over the terrain.
Post-frontal convection developed rapidly and was most
expansive between 1100 and 1900 UTC. All three
aircraft were in flight during this time. The DC-8
executed a series of loops that extended from the
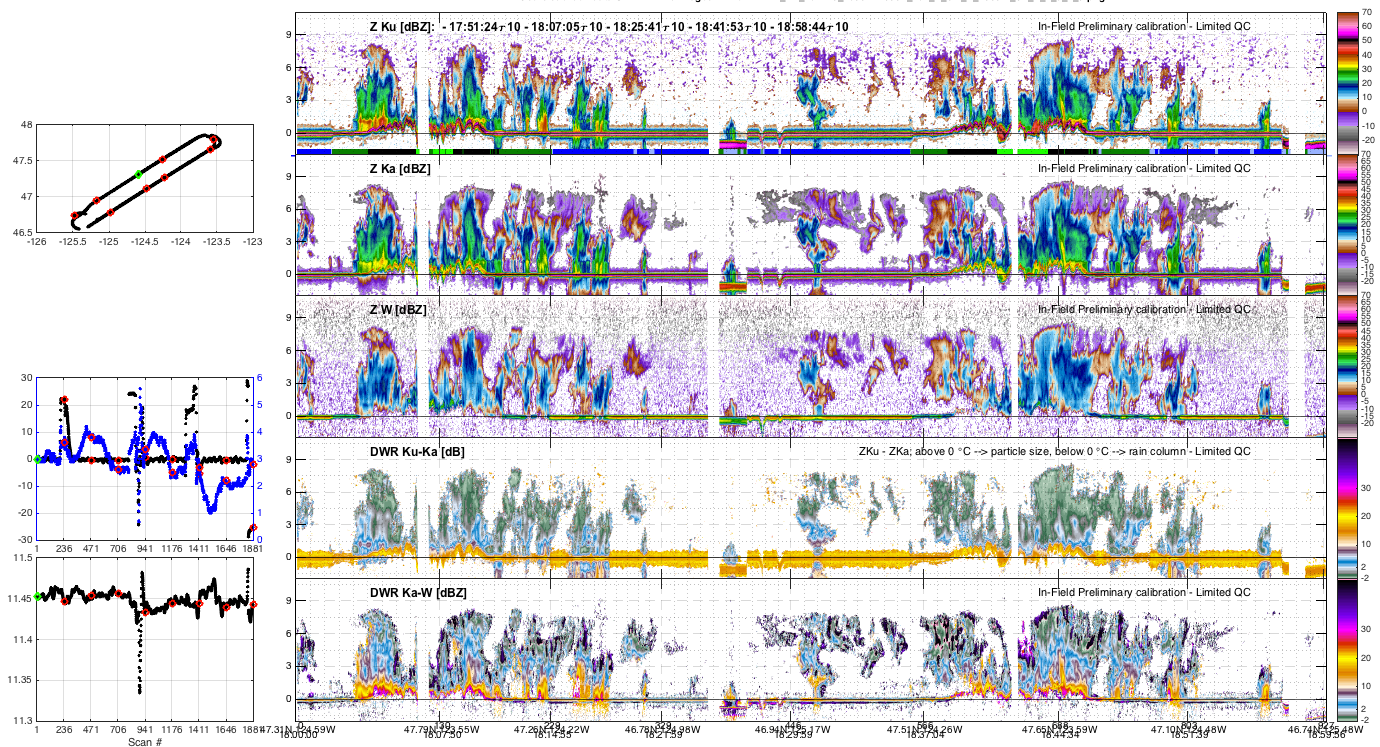
crest of the Olympics to the Pacific Ocean. Figure 7 shows that as the plane
flew from the ocean to the mountains convection
transitioned from scattered showers to regions of
wider, contiguous deep convective elements. The NPOL
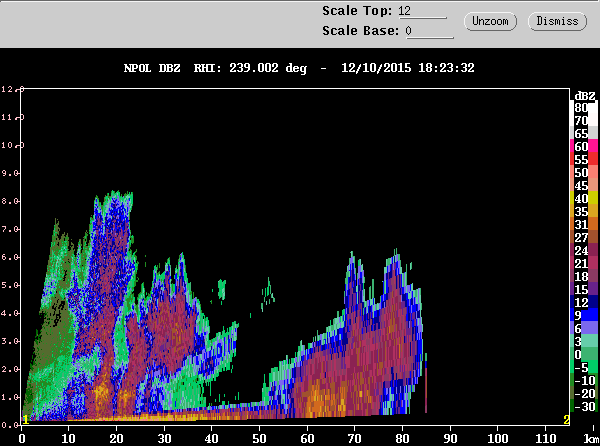
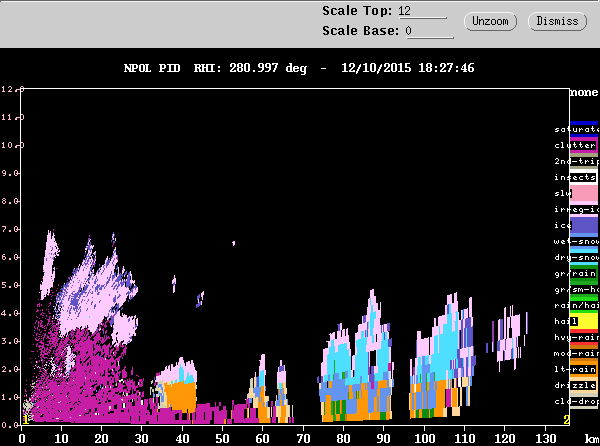
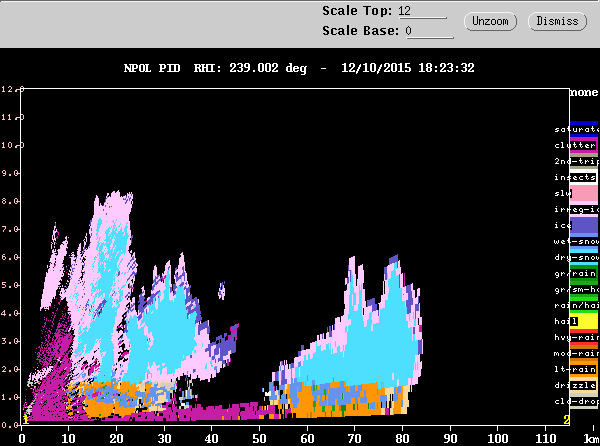
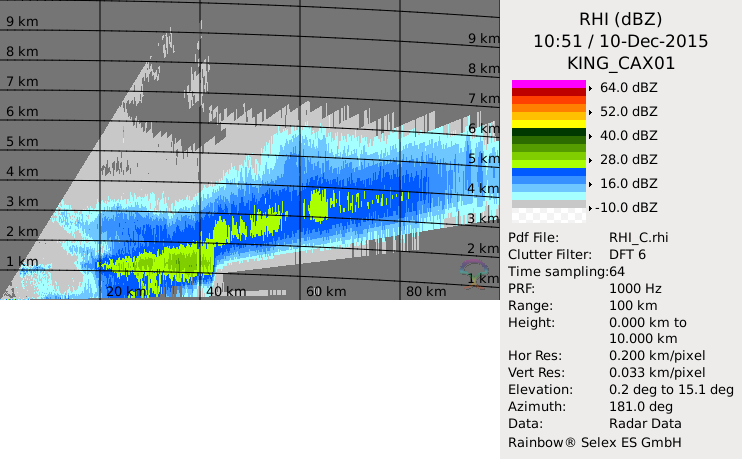
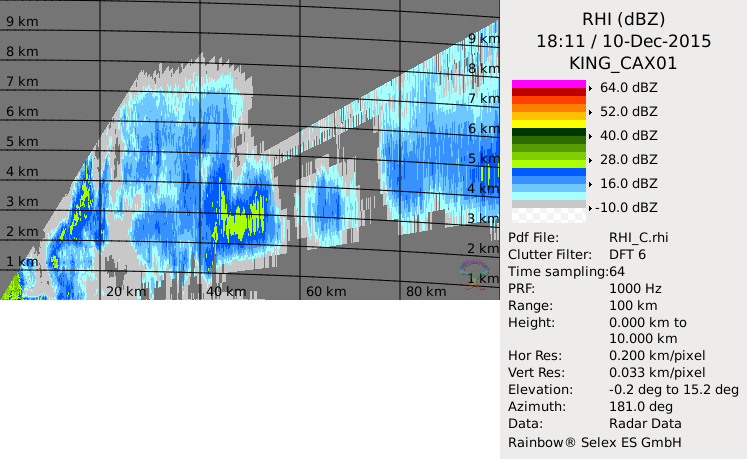
and DOW radars showed a similar cloud population. Figure 8 shows two NPOL
cross-sections of convective cells at 1800 UTC over
the ocean. While some isolated cells were reaching
nearly 9 km, most cells were only 5-6 km deep and very
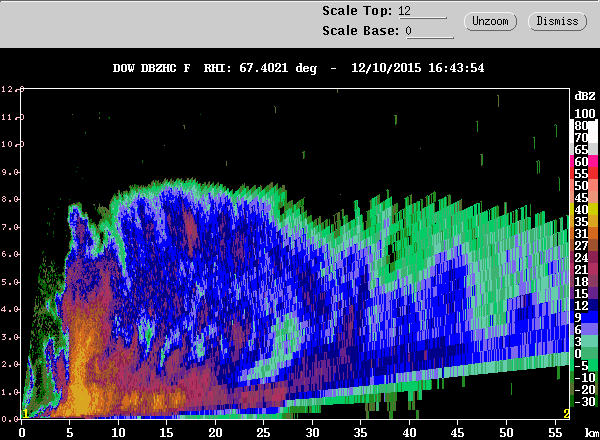
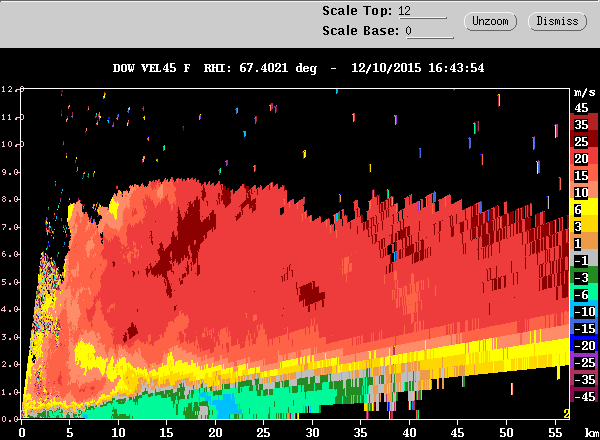
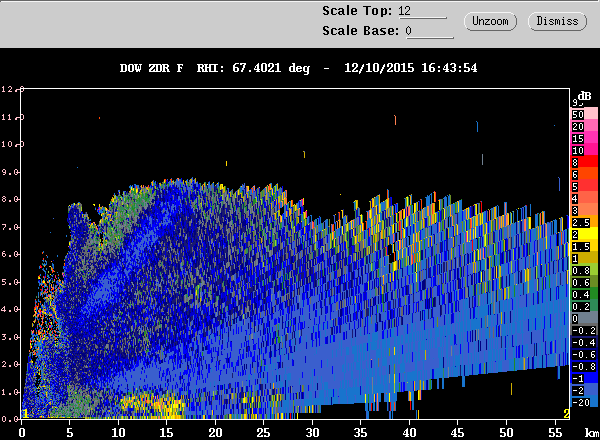
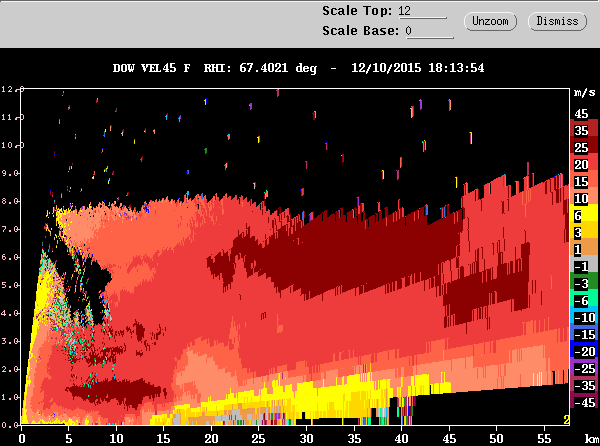
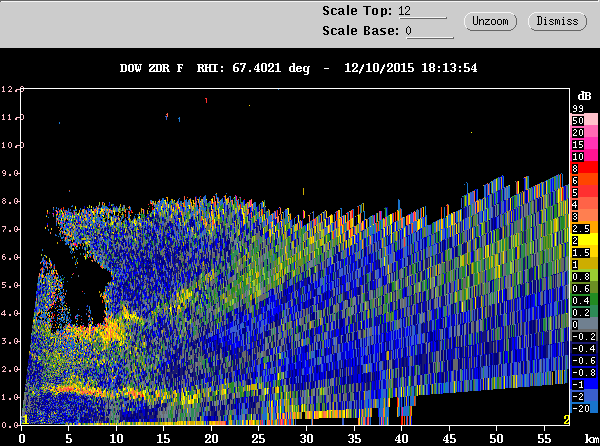
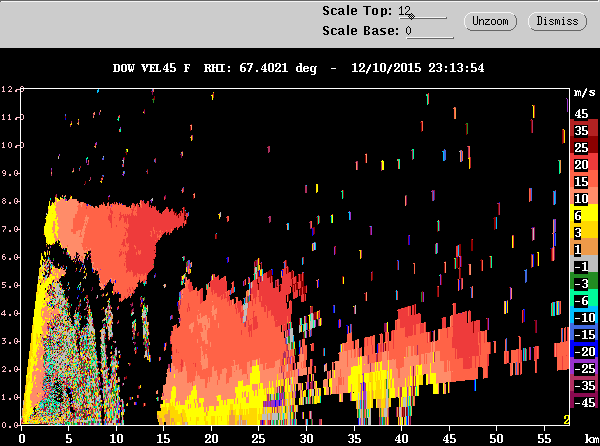
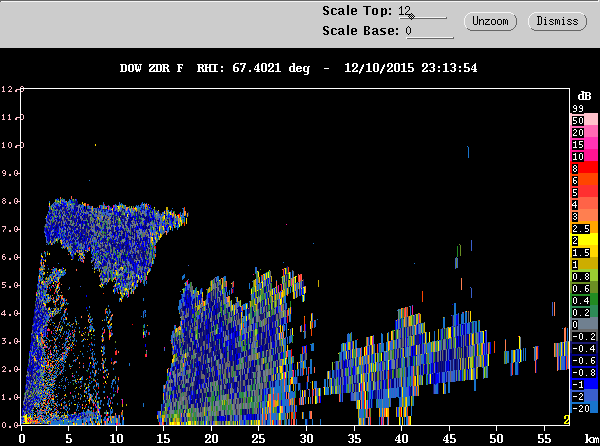
few of the cells were horizontally expansive. The top
two rows of Figure 9 shows
convection observed by the DOW radar over the Quinault
Valley. Convection over the mountains repeatedly
reached 9 km and was horizontally expansive, likely
promoted by lifting of the westerly component flow
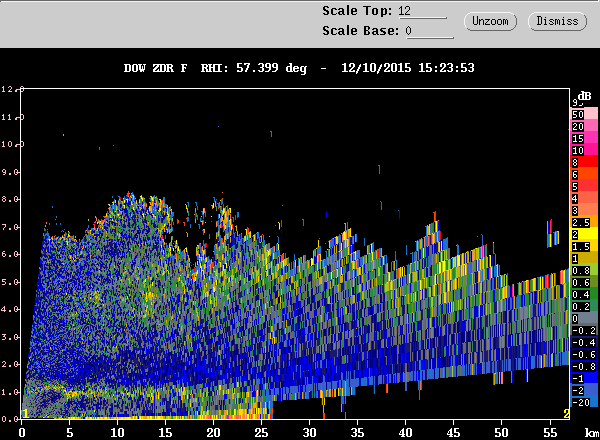
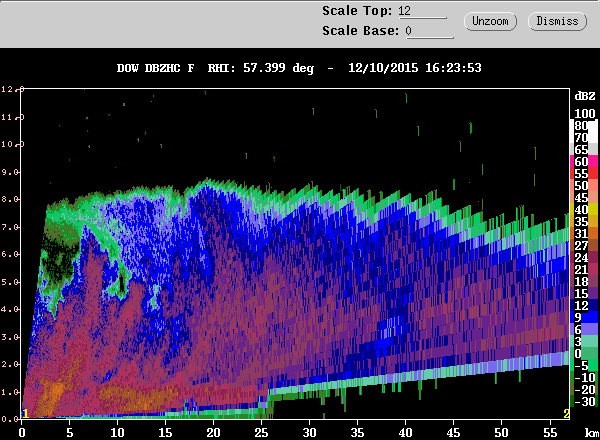
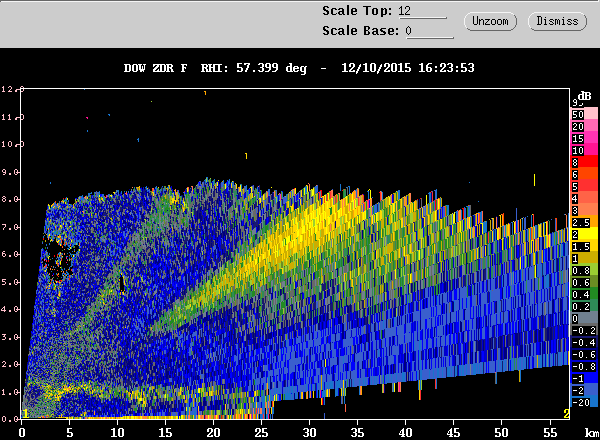
over the terrain. The intense cell observed by the DOW
radar at 1643 UTC (top row of Figure
9) had high reflectivity and differential
reflectivity at the surface suggesting the presence of
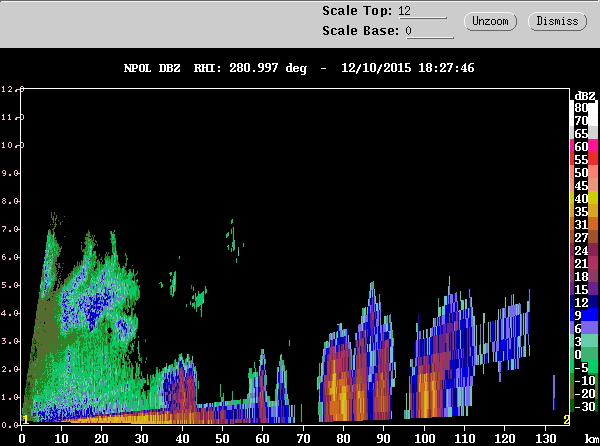
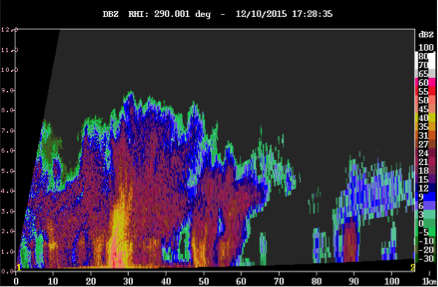
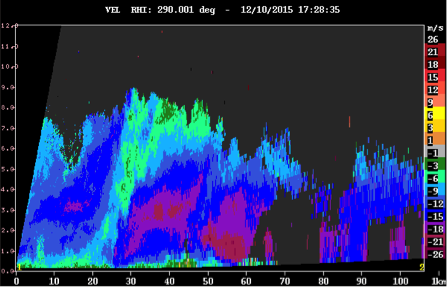
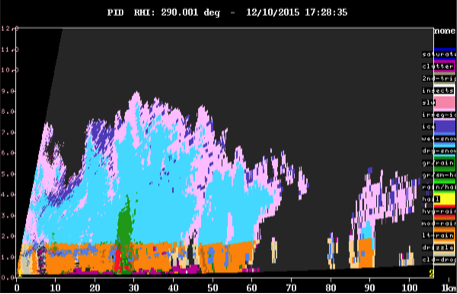
large drops. Scientists at the NPOL and DOW radars
observed graupel on several occasions today. An
example of one of these intense convective cells over
the ocean is shown in Figure 10.
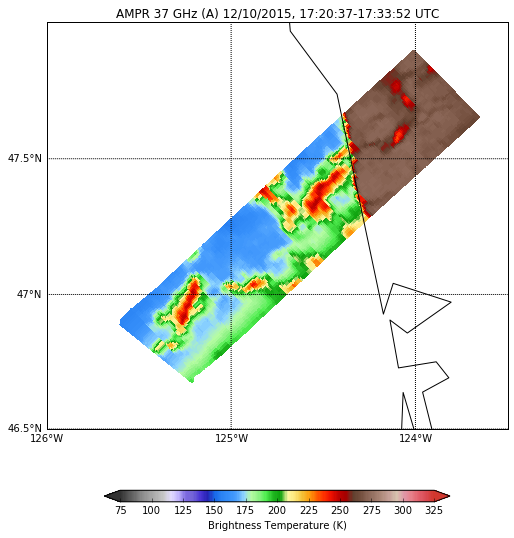
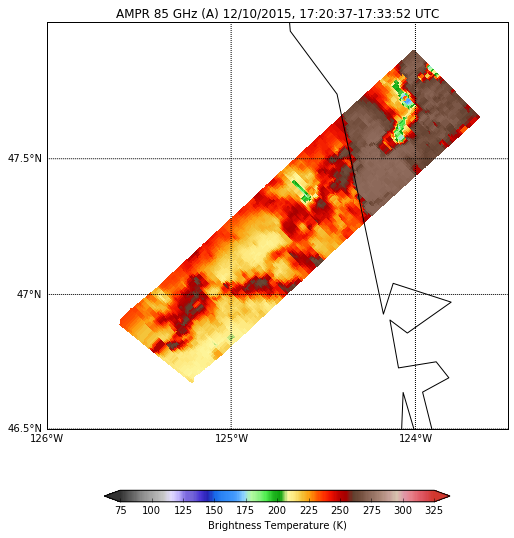
AMPR's 85 GHz channel aboard the ER-2 (Figure 11)
captured
significant ice scattering in some of these oceanic
cells (below 200 K), which is consistent observations
of lightning in some of these cells. Comparing Figures 6 and 9 shows that the down-valley
easterly-component flow was destroyed by the
convective cells. Between 1500 and 1600 UTC the
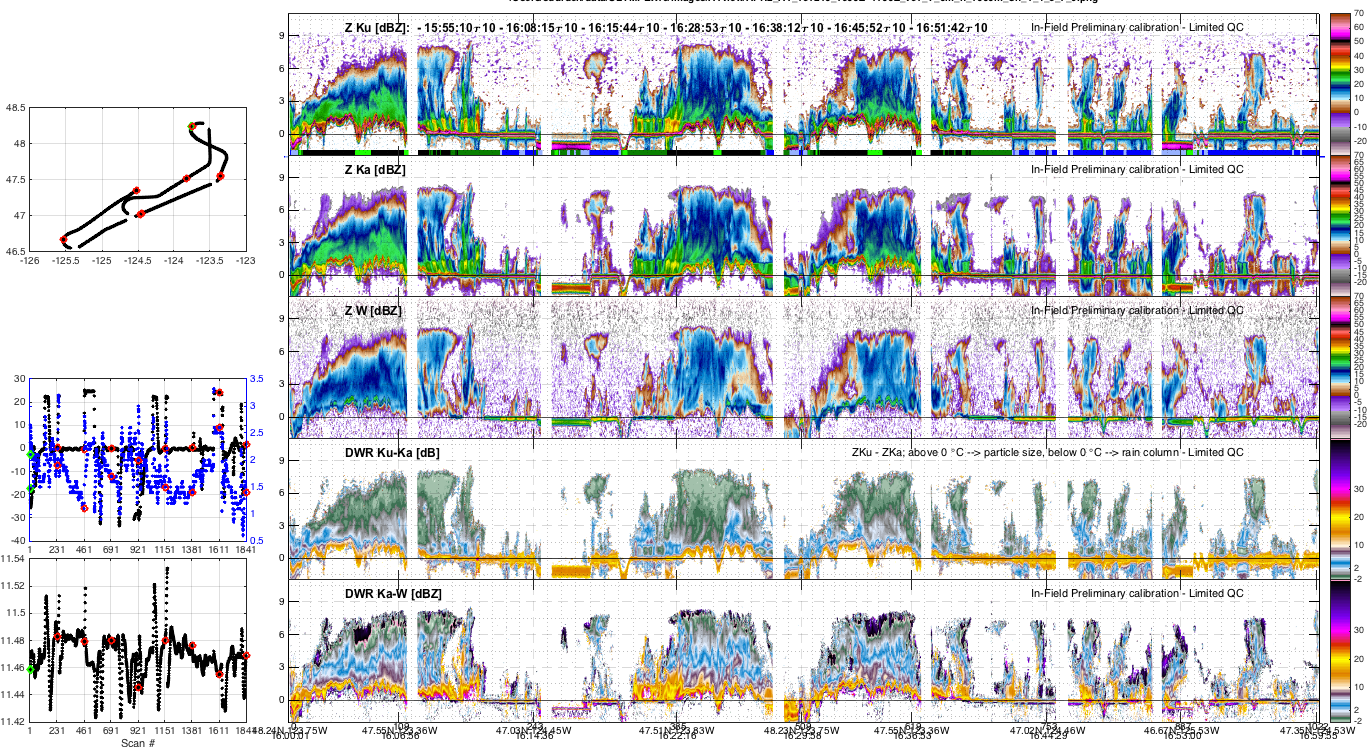
Citation conducted an ascending spiral and stacked
legs through the DOW domain. Figure
12 shows that plane sampled convection that was
becoming increasingly deep throughout this time.
Scientists on board the aircraft observed aggregates
at low levels, frequent capped columns at midlevels,
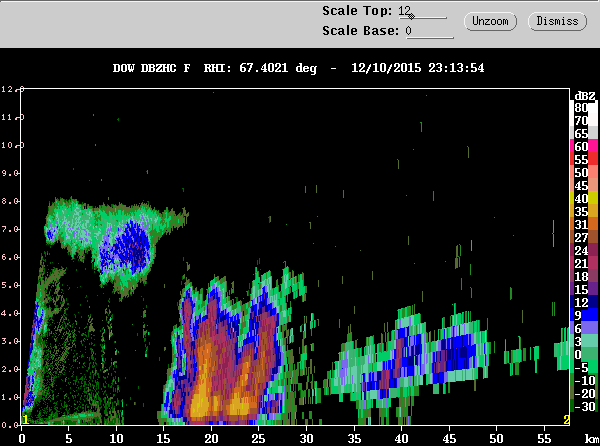
and large crystals at upper levels. The bottom row of
Figure 9 shows that convection
became more isolated and shallower over the mountains
late in the day.
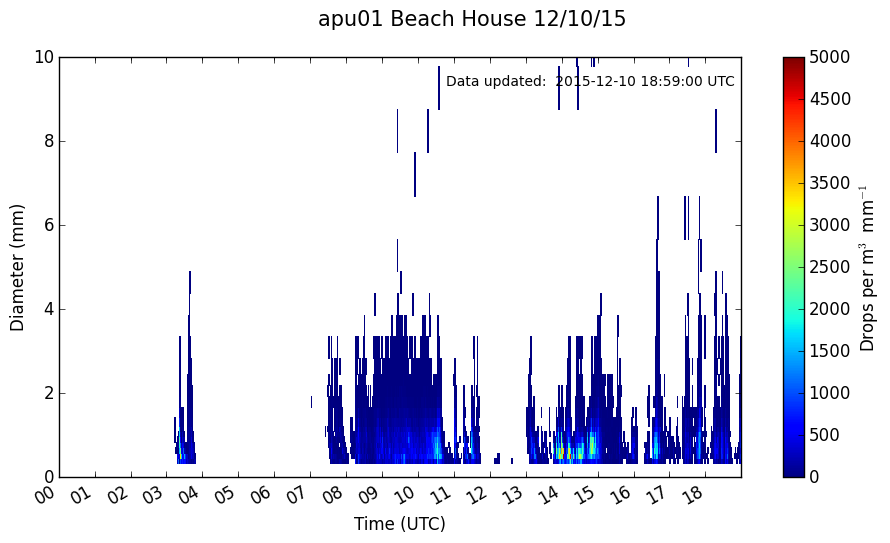
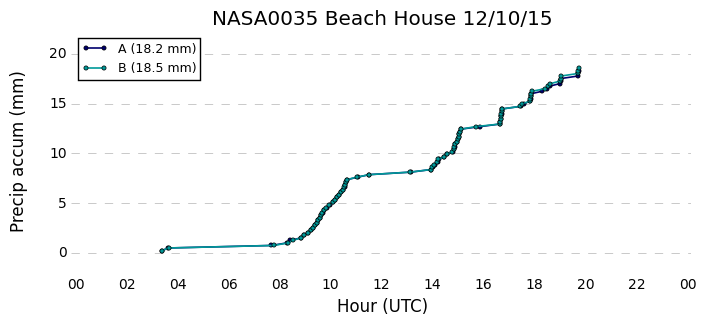
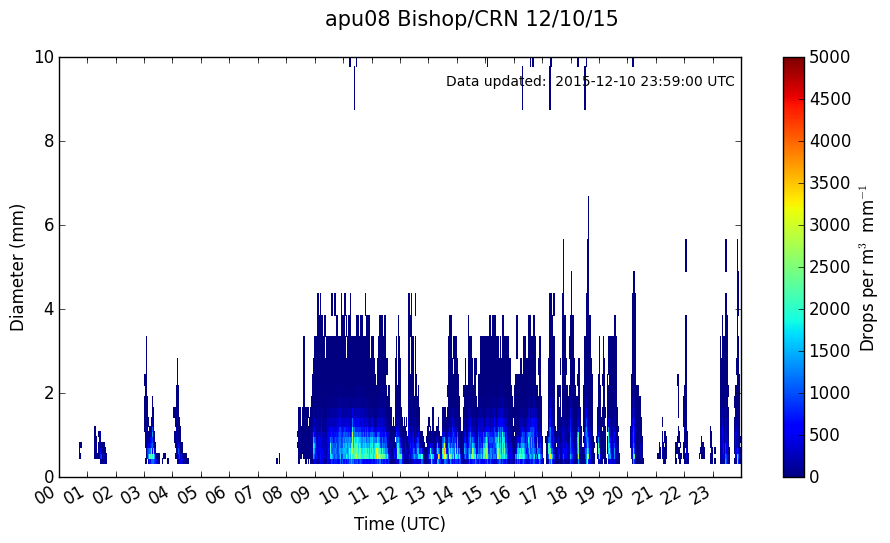
Figure 13 shows that the
particle size distribution varied markedly with
altitude. The Beach House had two distinct regimes
with a broad size distribution during the passage of
the occluded front and short periods of narrow size
distributions with lots of small drops occur between
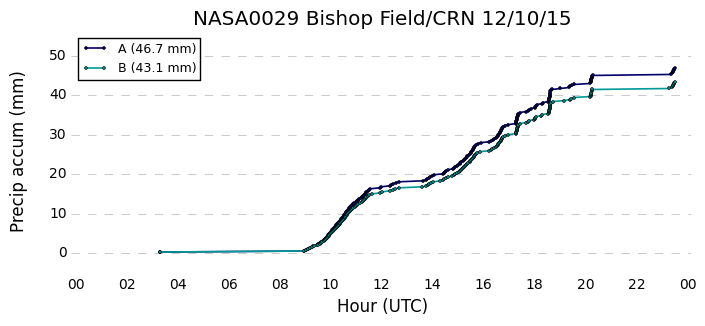
1400 and 1500 UTC (top row). At Bishop/CRN the broad
size distribution during the occluded front persisted
for a shorter period of time, and high concentrations
of small drops were observed almost continuously from
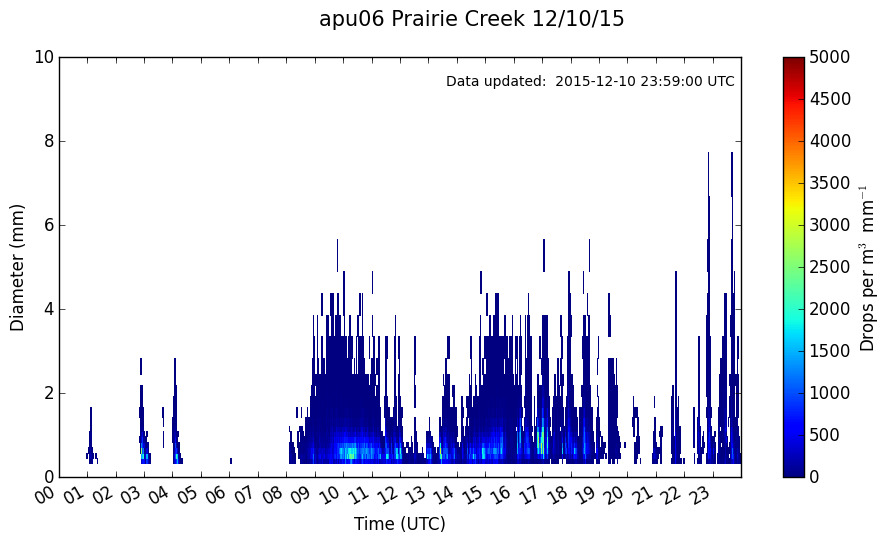
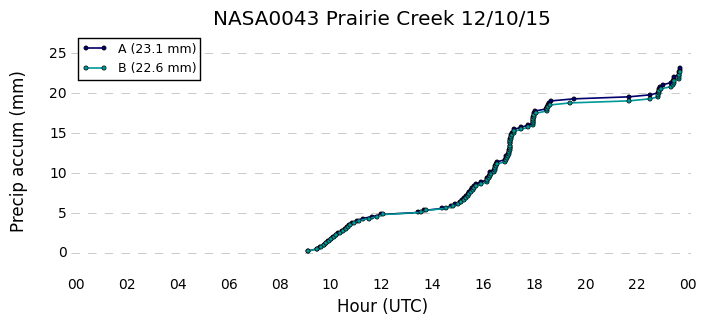
1100-1800 UTC (middle row). Prairie Creek (bottom row)
also observed a broad size distribution for only a
short period of time but the concentration of small
drops between 1100 and
1800 UTC was much less than Bishop
Creek. Of these three locations Bishop/CRN received
the highest rain accumulations.
The Environment Canada X-Band radar showed strong
convection over Hurricane Ridge associated with both
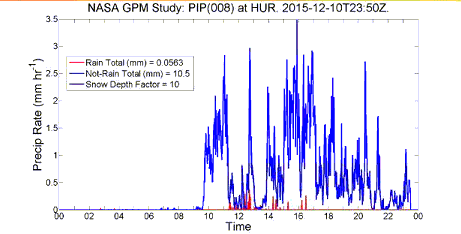
the occluded front and post-frontal convection (Figure 14). The PIP instrument
on Hurricane ridge indicated that precipitation was in
the form of snow throughout the day (Figure
15).
|