The 24 h period was
extremely rainy in the OLYMPEX region, especially on the
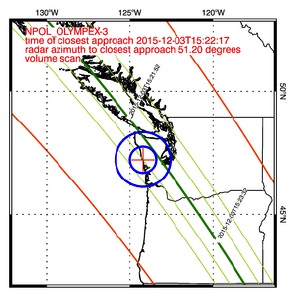
south facing slopes of the Olympic Mountains. A GPM core overpass was centered over
the Olympic Mountains during this rainy period (Figure 1), and the three OLYMPEX
aircraft flew a coordinated mission timed to coincide
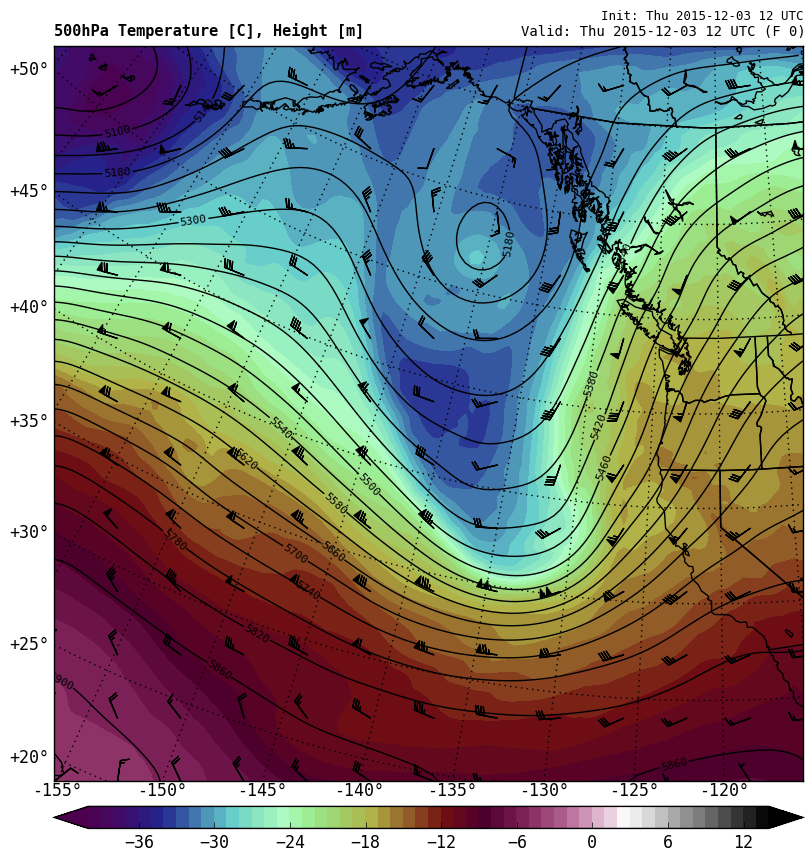
with the overpass. The parent weather situation and
cloud pattern was associated with a baroclinic short
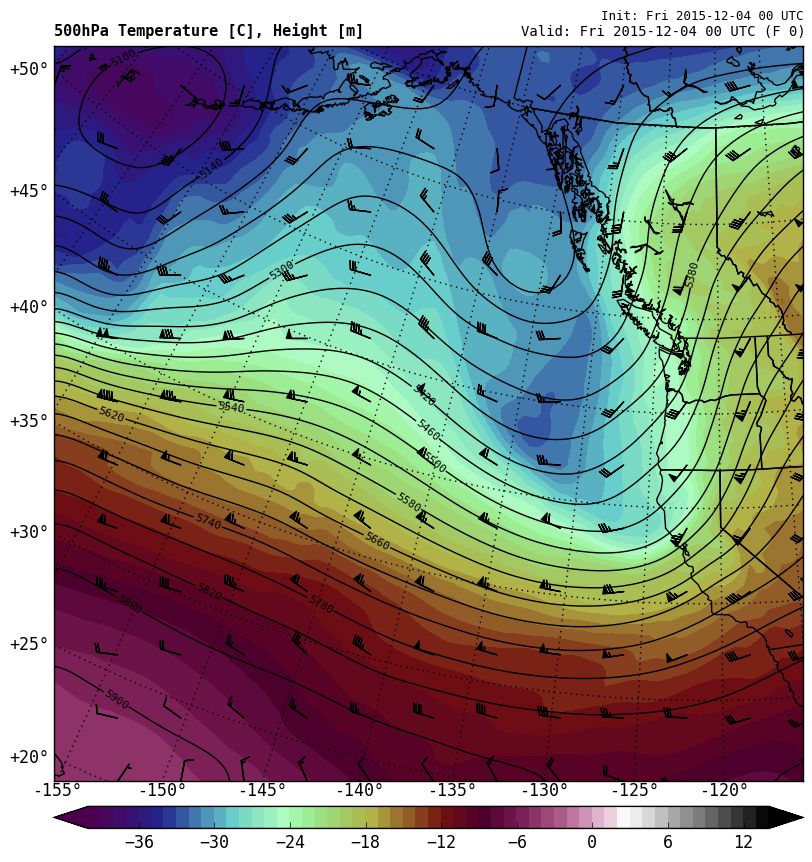
wave system undergoing a complex evolution. At 500 hPa,
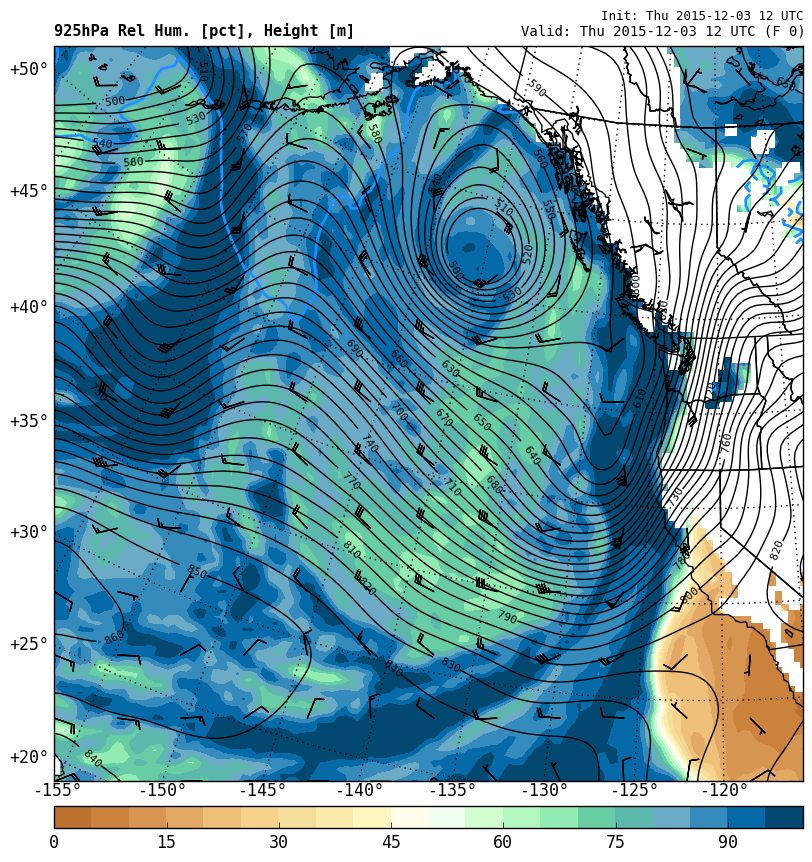
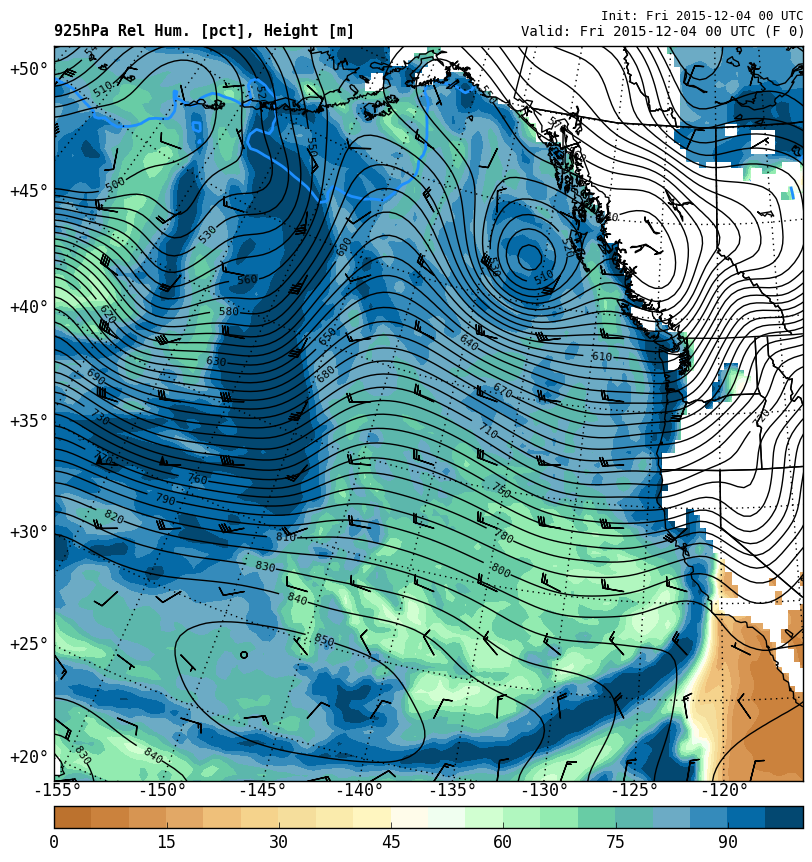
a trough was approaching and passing over the region (Figure 2, upper panels). At 925 hPa,
the flow was very moist and initially southerly,
changing to westerly (Figure 2, middle
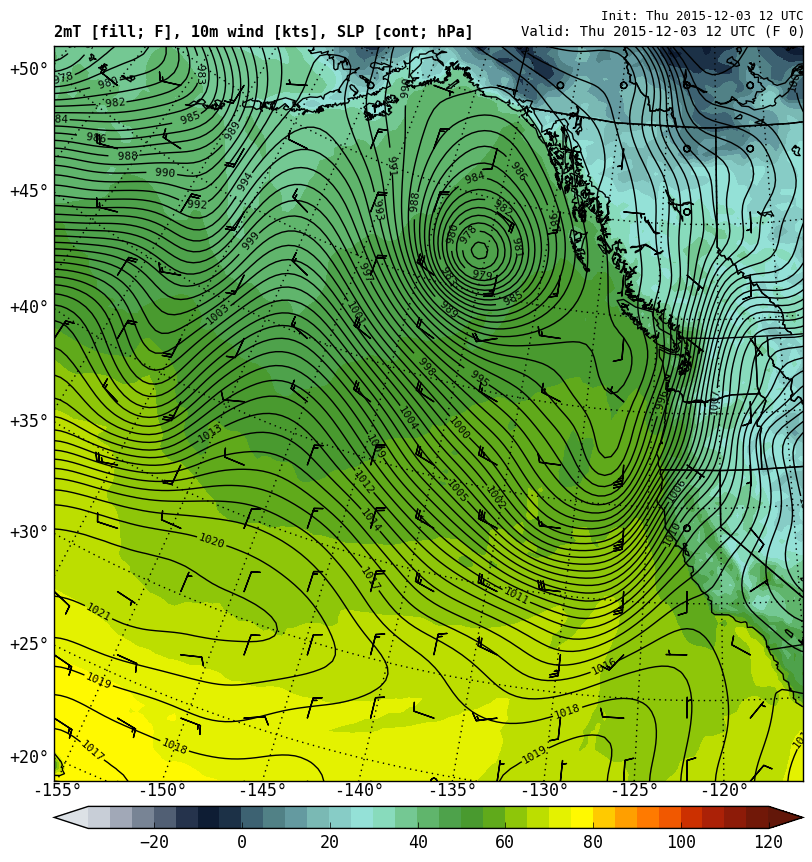
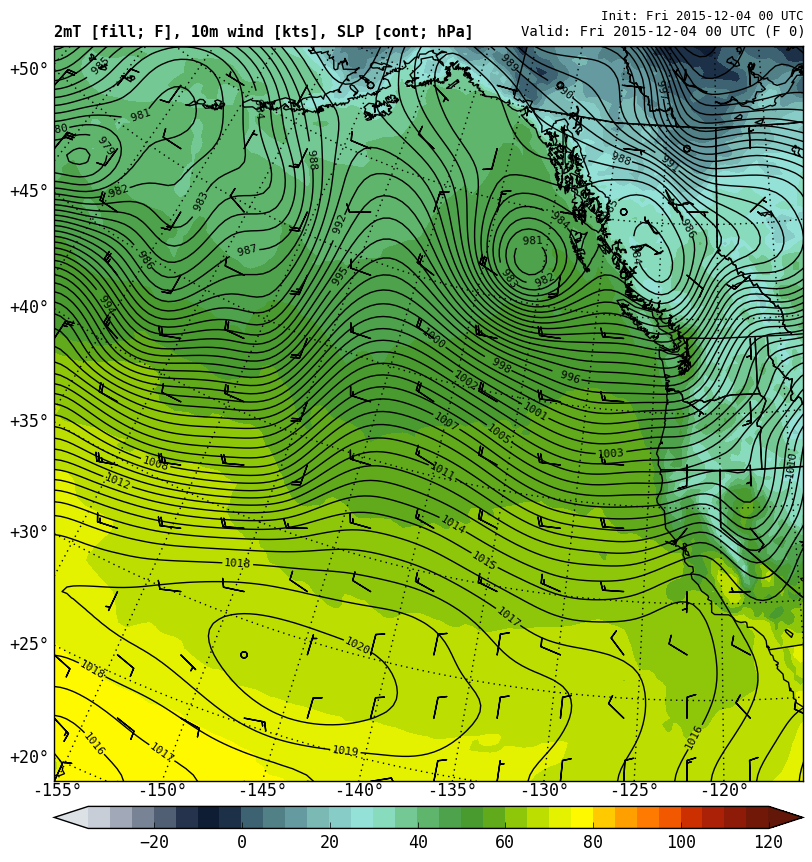
panels). At the surface, the air was warm with
only a slight temperature gradient (Figure
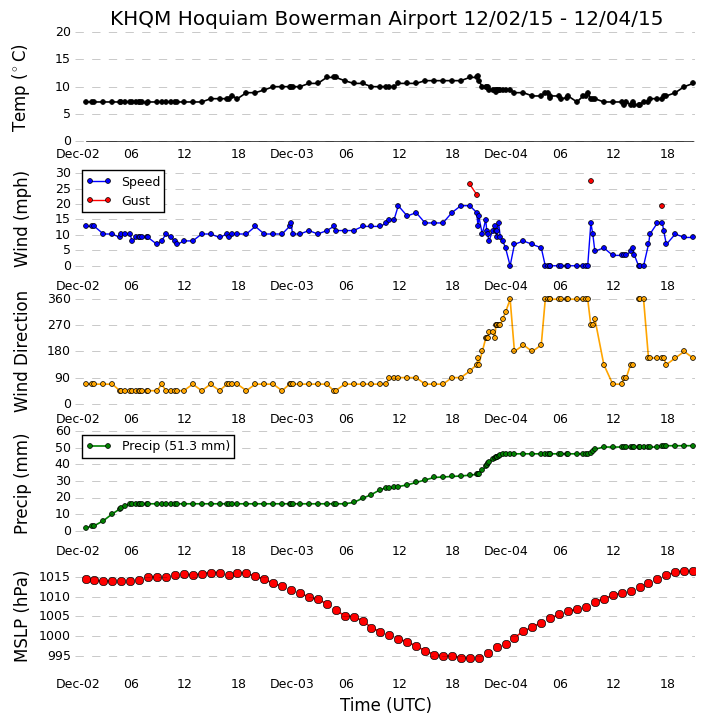
2, lower panels). Surface observations support the
presence of a weak front. The surface time series at
Hoquiam and other coastal stations showed a somewhat
frontal-like pressure minimum, wind shift, and
temperature drop with the trough passage (Figure
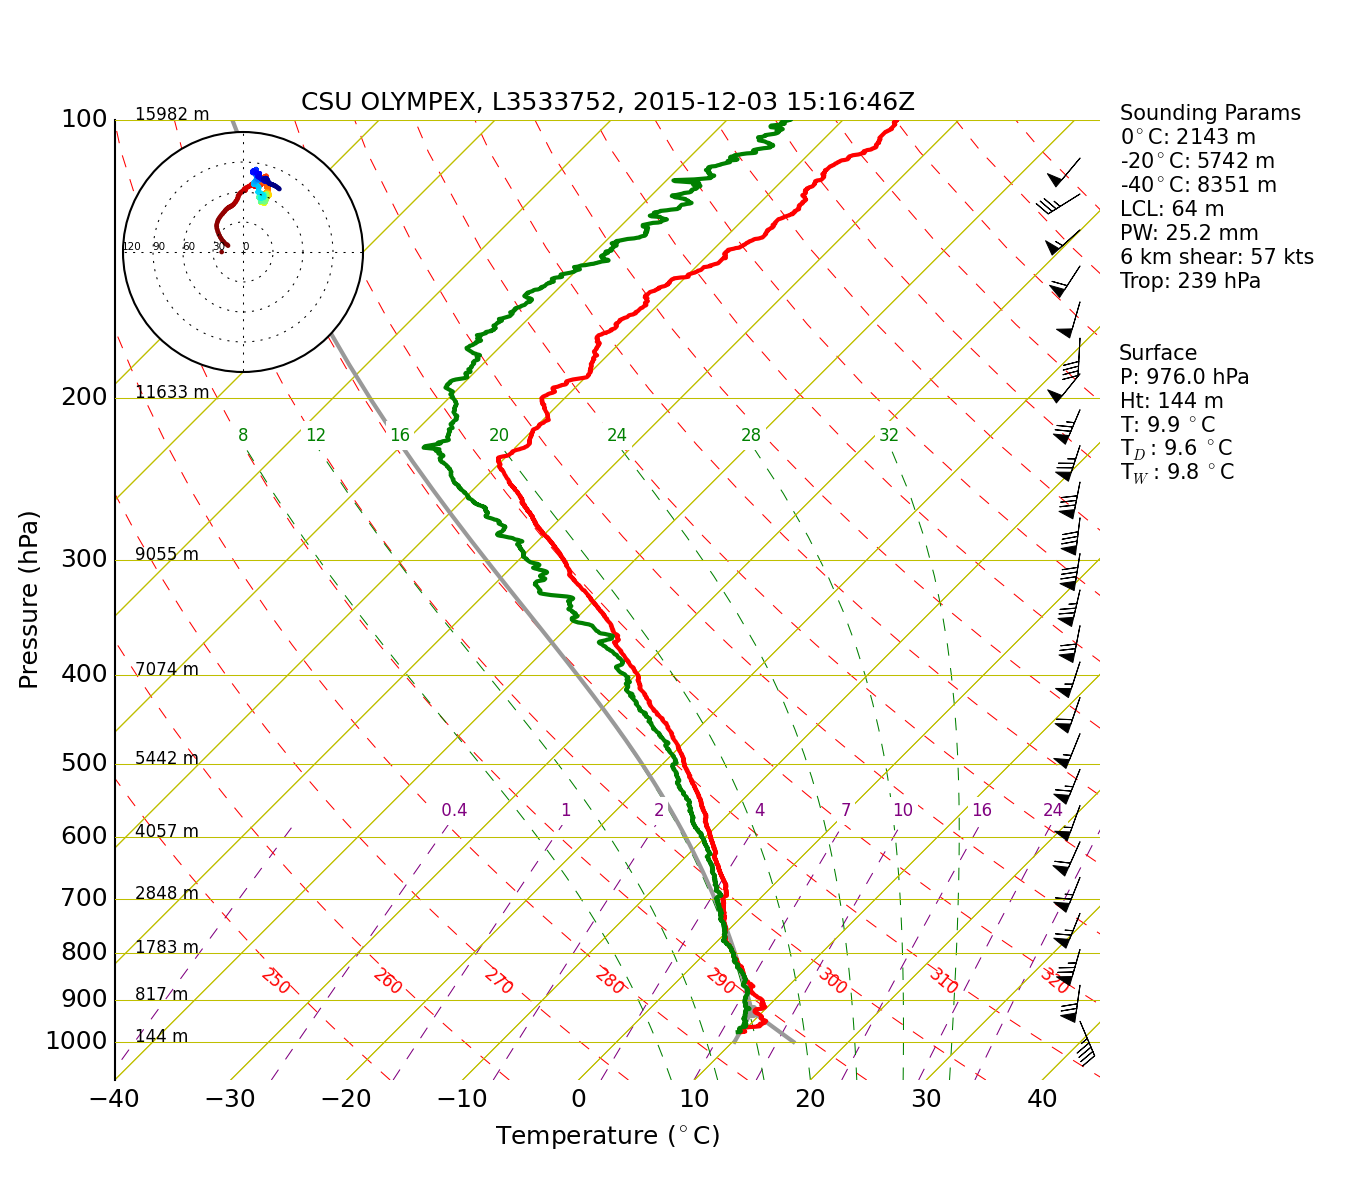
3). The sounding at NPOL (Figure
4, left), obtained at the time of the overpass and
when the aircraft were flying, showed saturated
condition through the depth of the troposphere. The wind
at most levels was strong south-southwesterly, which
accounted for strong orographic enhancement of the
baroclinically forced precipitation. The wind near the
surface had an easterly component. The wind profiler at
Forks (northwest coast of Washington) did not show the
easterly component but rather showed the low level winds
to be primarily southerly throughout 3 December until
the shift to westerly at the end of the 24 h period,
after the weak frontal passage (Figure
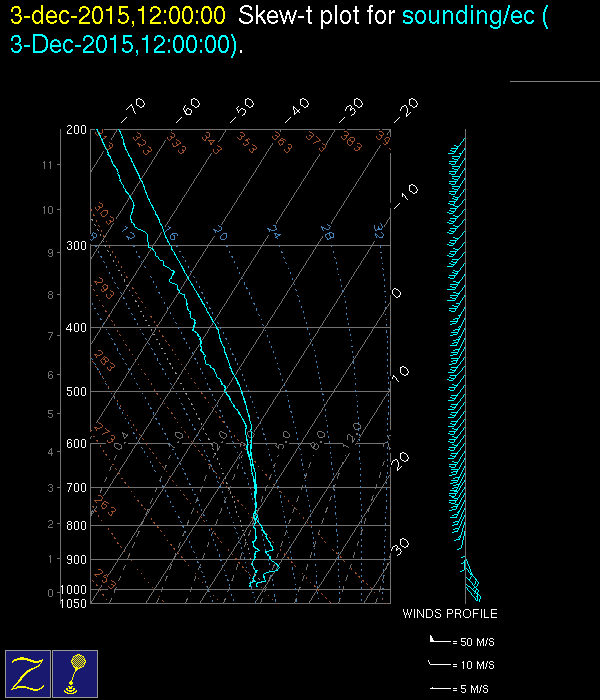
5). The sounding at the Environment Canada site in
Victoria (Figure 4, right),
northeast of the Olympic Mountains, also showed a deep
cloud layer and dry southeasterly flowing air at low
levels.
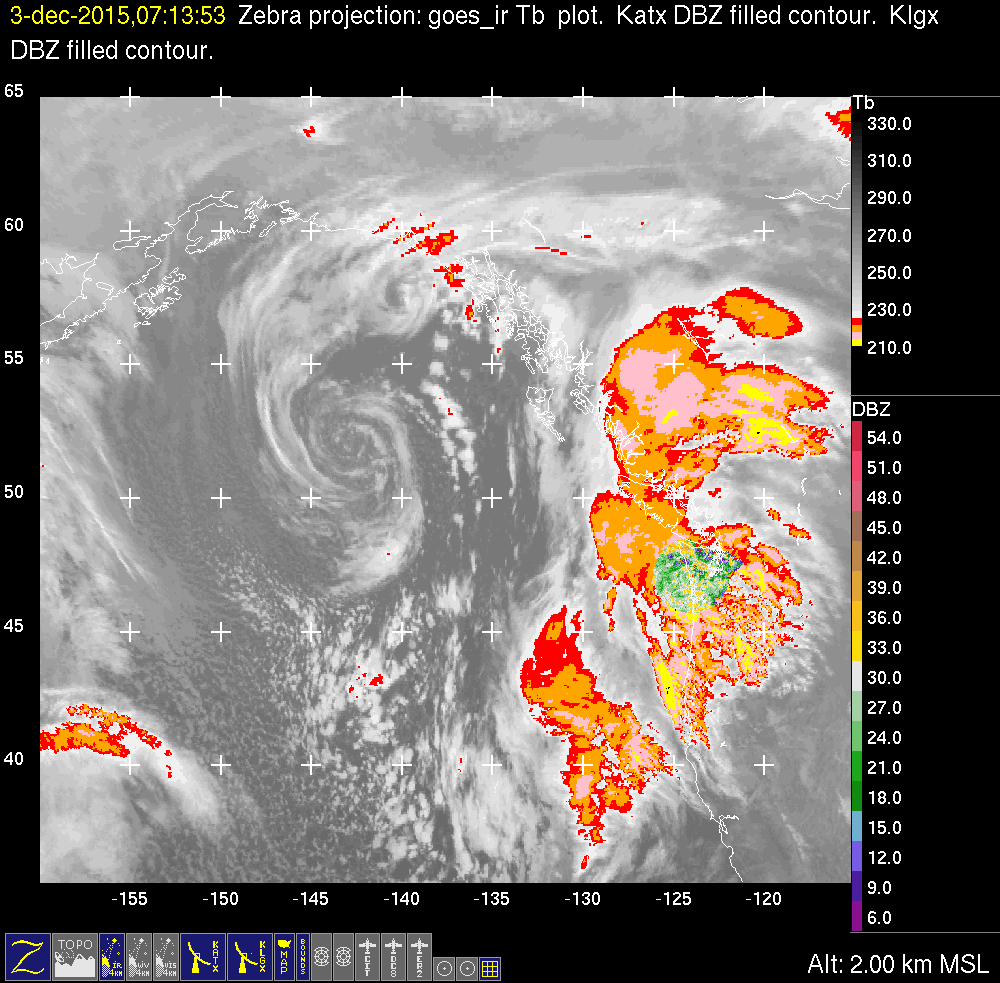
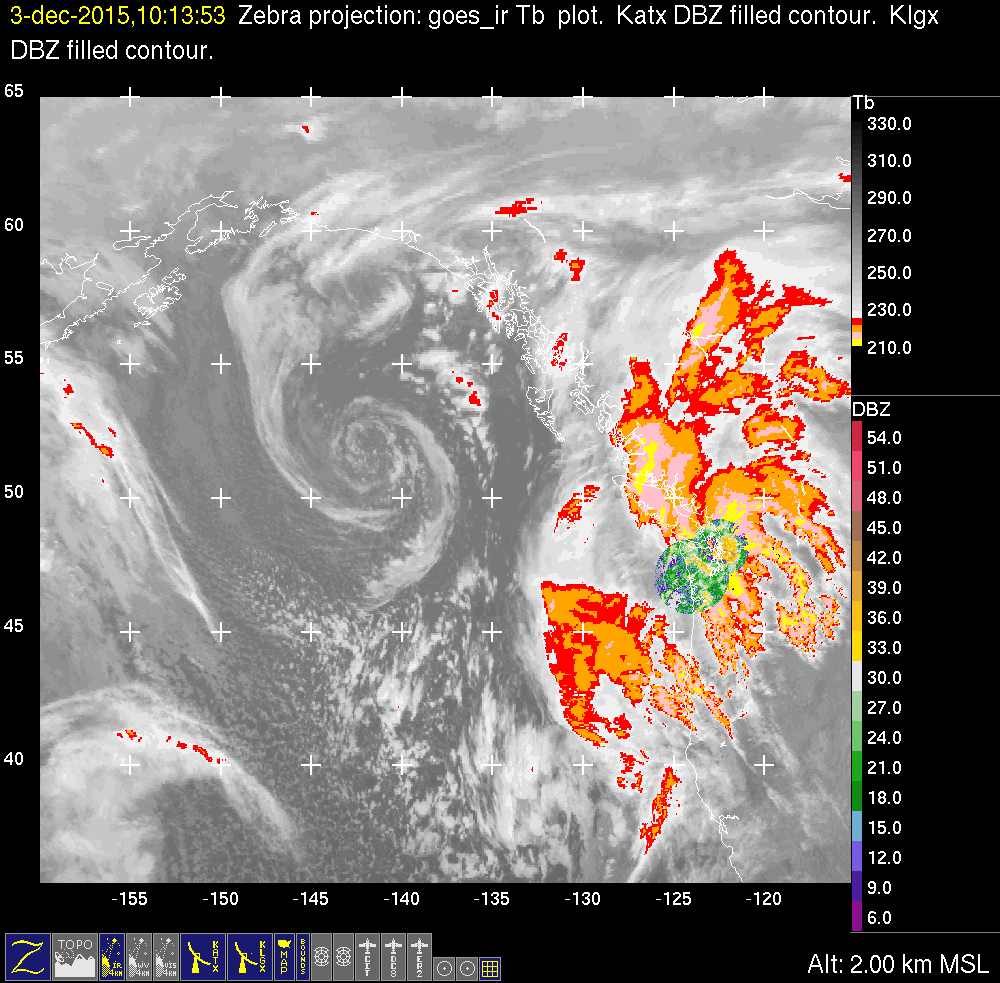
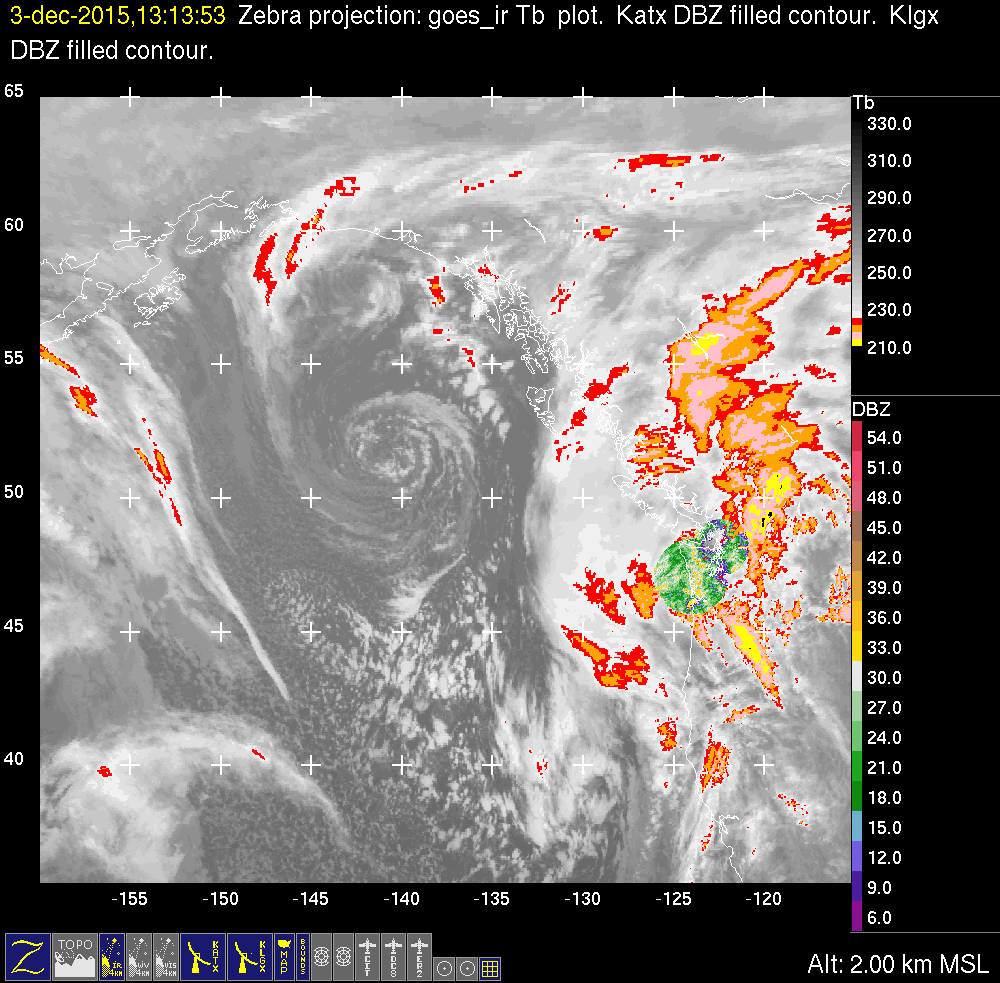
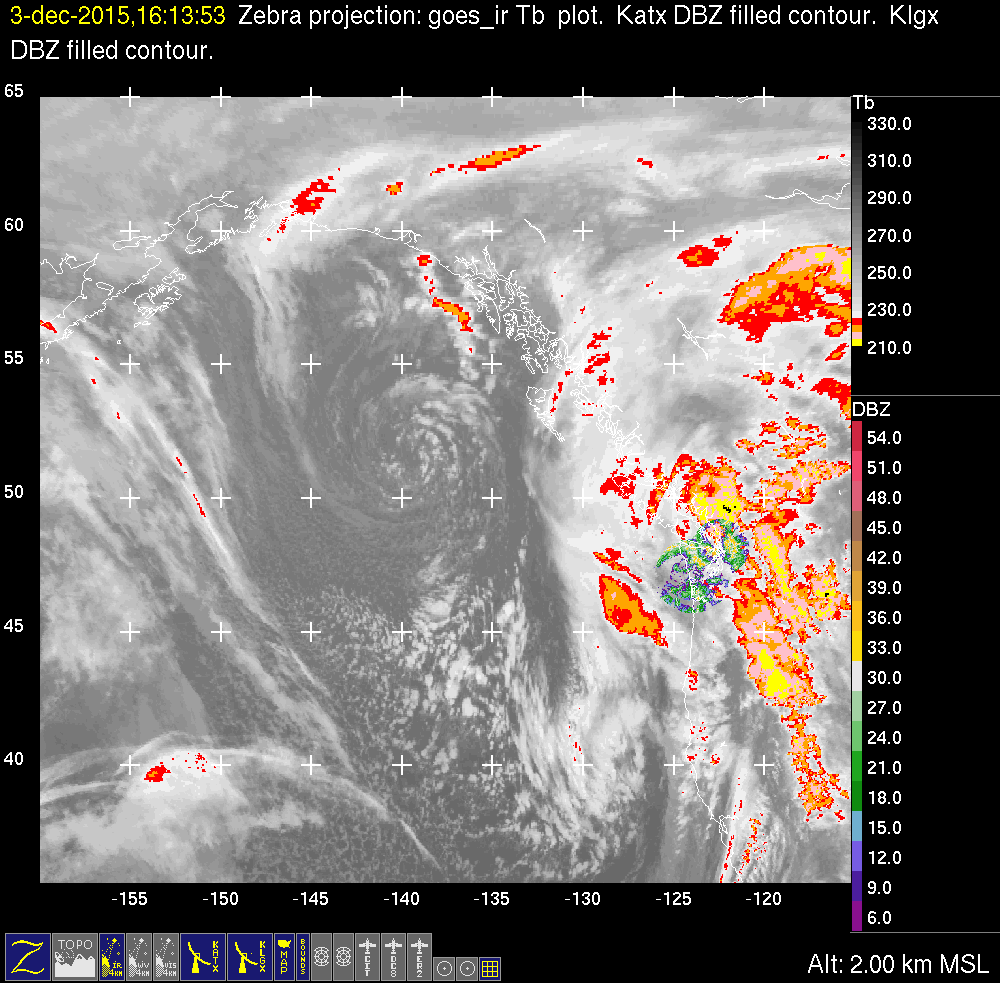
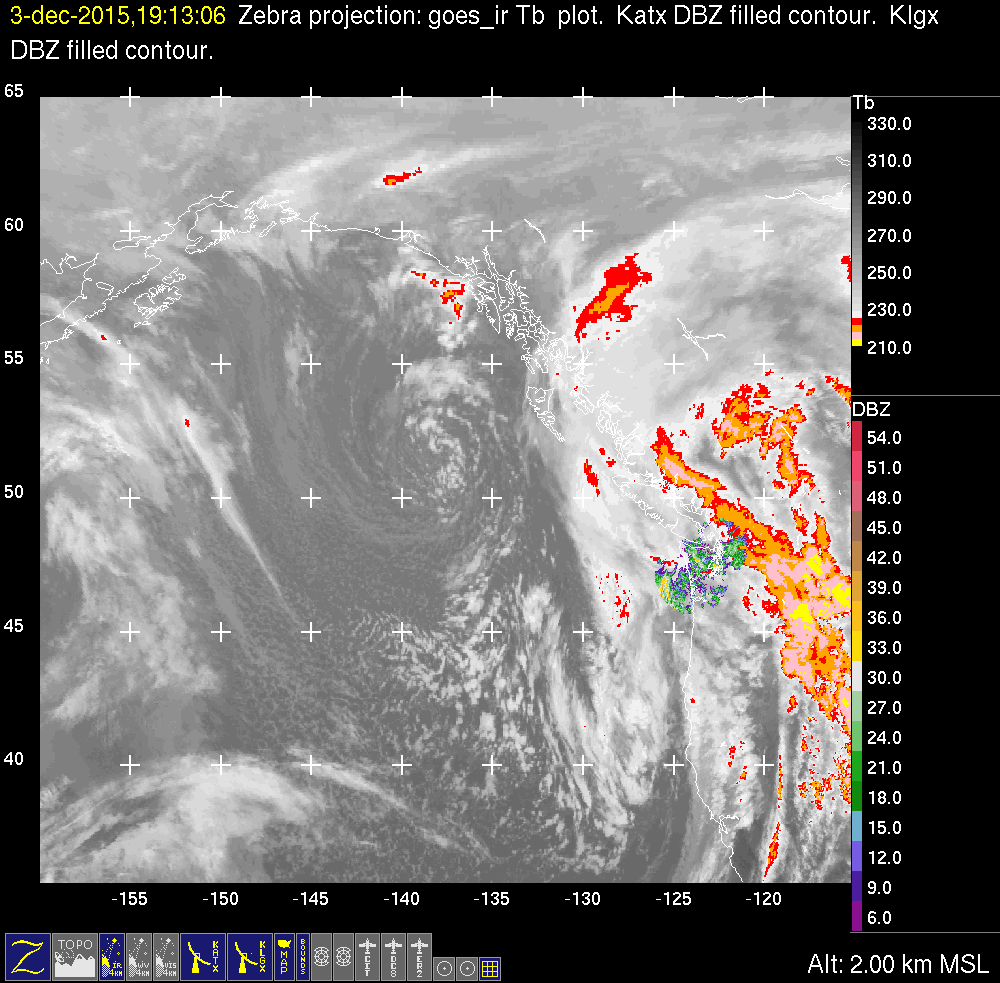
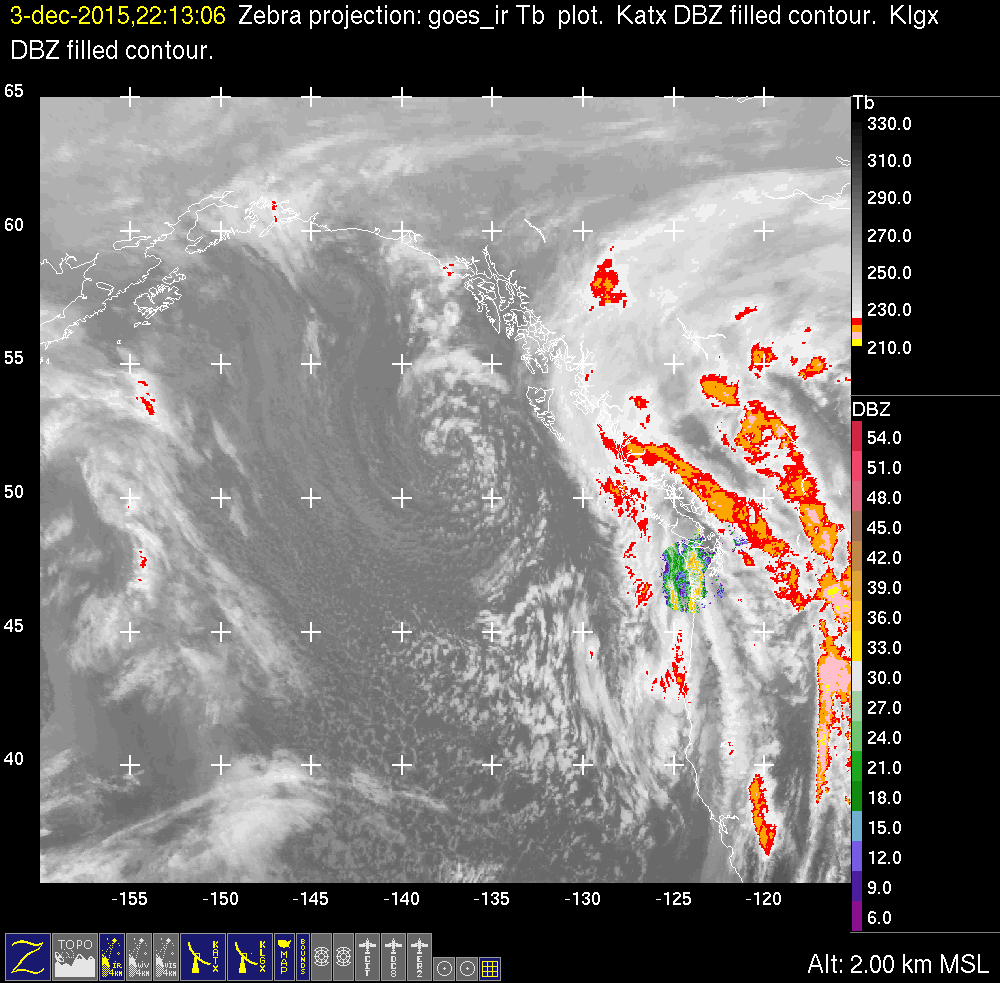
The infrared satellite sequence overlaid on the Langley
and Camano radar reflectivity (Figure
6) illustrates the complexity of the cloud system
associated with these synoptic conditions. Generally
speaking, a great mass of high cloud top was moving over
the region. At the time of the overpass and flights (see
panels for 1313 and 1613 UTC), the cloud mass was
breaking apart, probably in response to a wave formation
over the ocean to the west. Despite this fracturing of
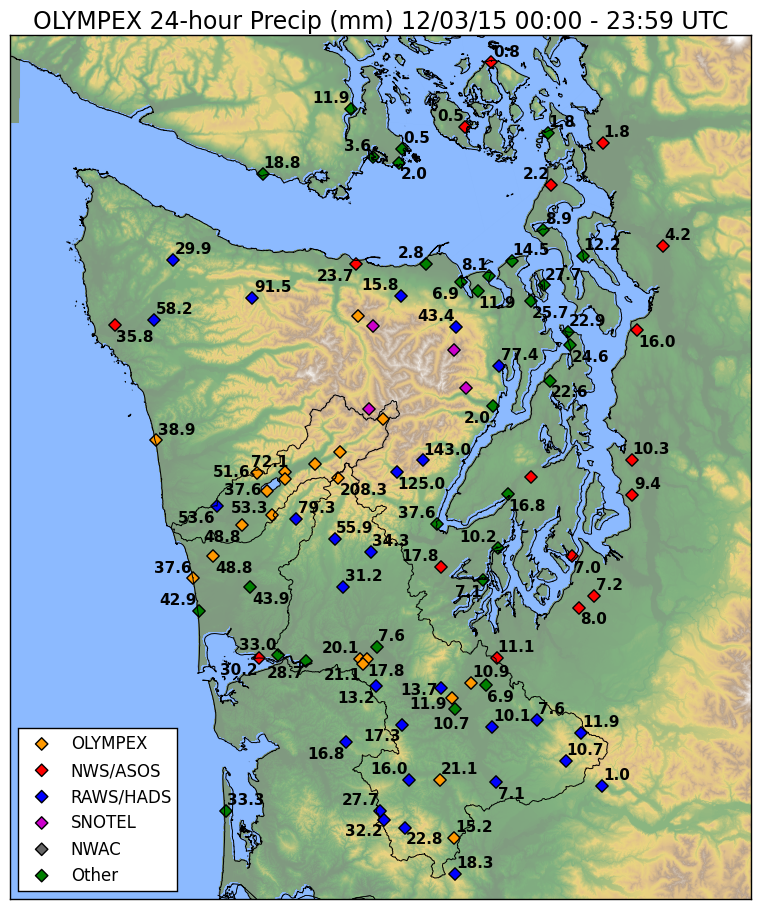
the cloud pattern, considerable rainfall was occurring
over the mountains and within the GPM overpass. The rain
accumulations were especially large on the south facing
slopes of the terrain (Figure 7).
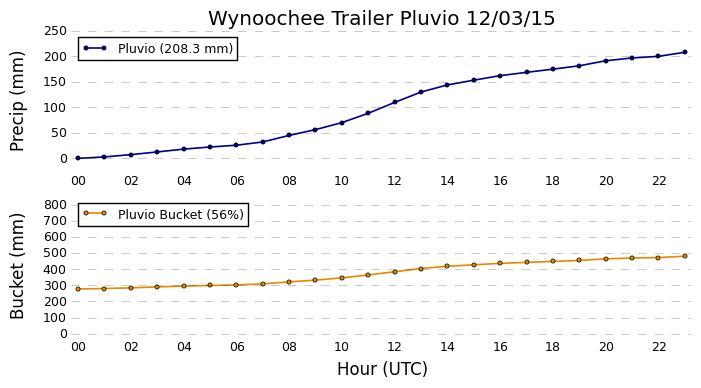
On the ridge on the south side of the Quinault Valley,
rain amounts were ~100-200 mm. The OLYMPEX
Wynoochee trailer site recorded ~200 mm (left panel, Figure 8). Amounts in the
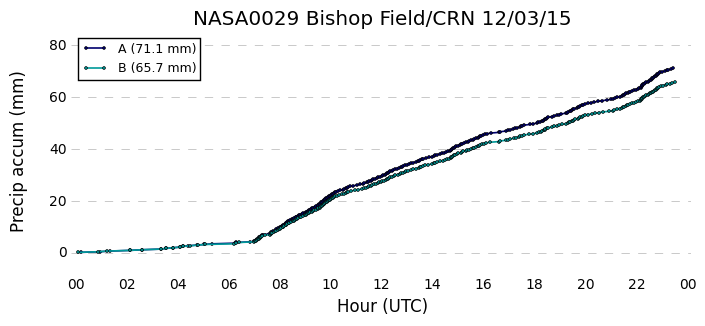
valley were also considerable but not as large; e.g.,
The Bishop/CRN site registered ~70 mm (right panel, Figure 8). The difference in
these amounts is a rough indication of the degree of
orographic modification.
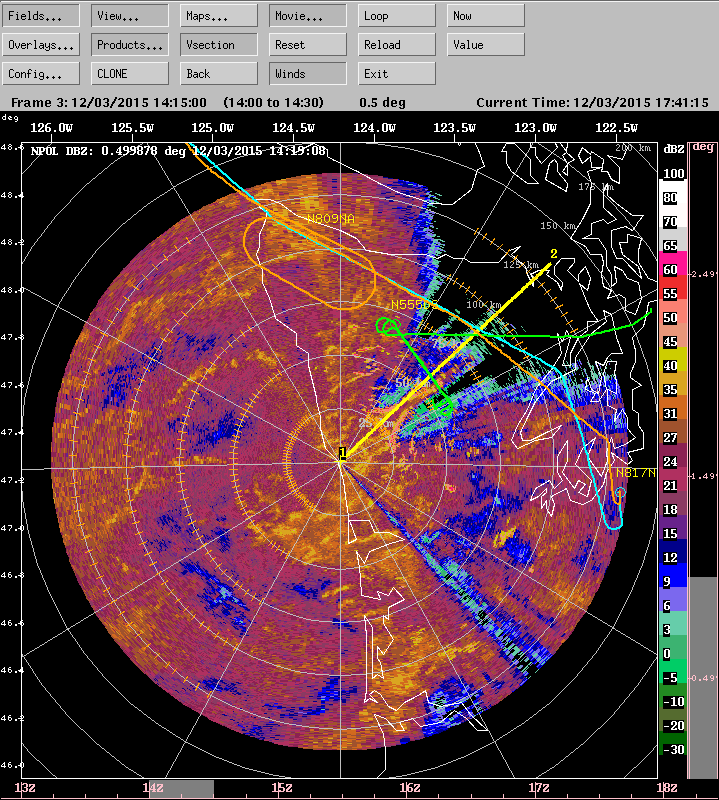
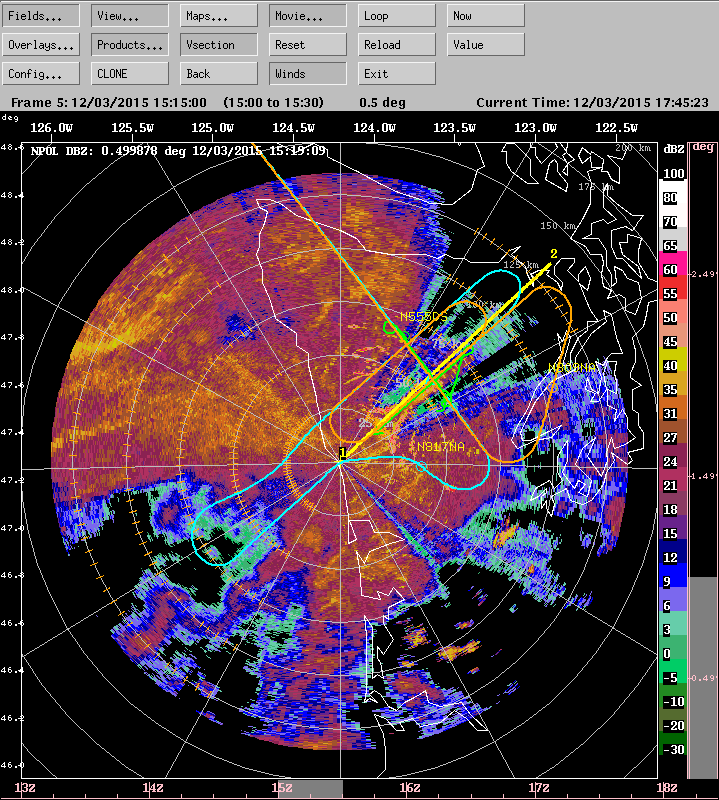
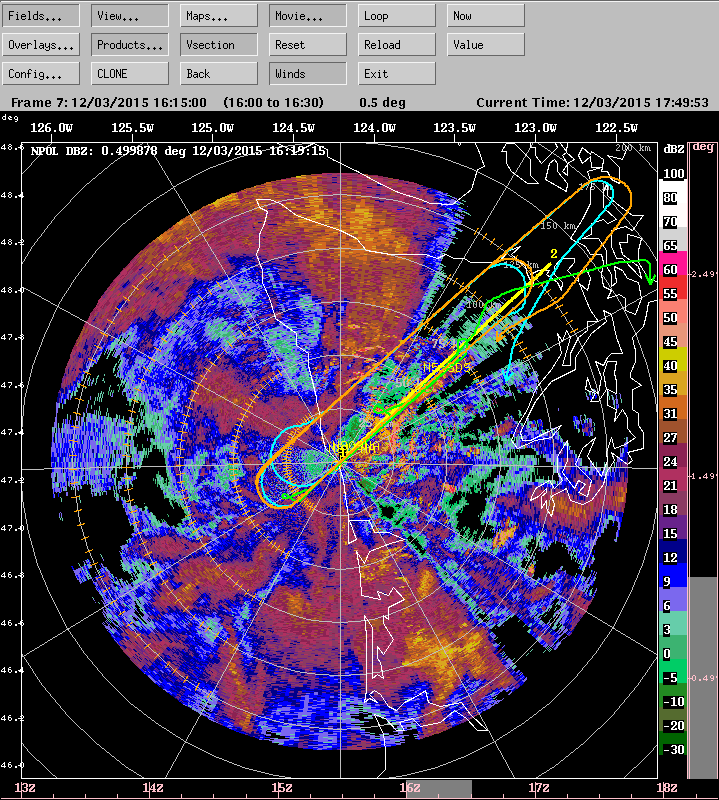
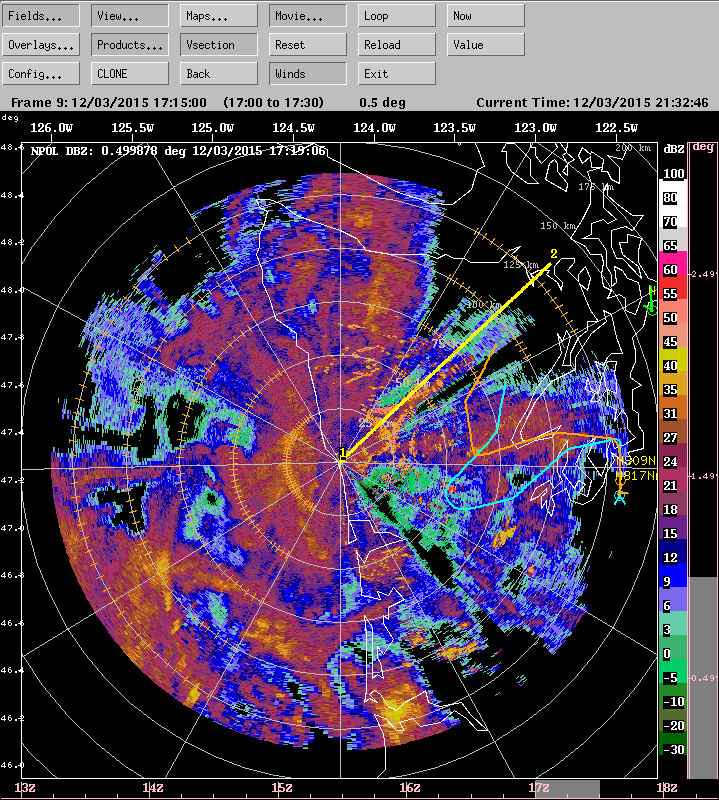
The OLYMPEX radars, aircraft, and ground sites captured
many details of this complex cloud pattern and
orographic enhancement of the precipitation. Figure 9 shows the highly
coordinated aircraft tracks superimposed on the NPOL
radar reflectivity. The first part of the flight sample
the downstream events on the north and northeast sides
of the Olympic Mountains. During the time most closely
corresponding to the GPM overpass (Figure
1), the flights worked along lines
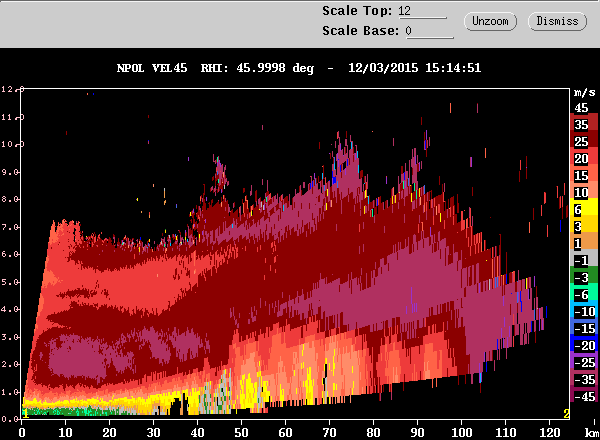
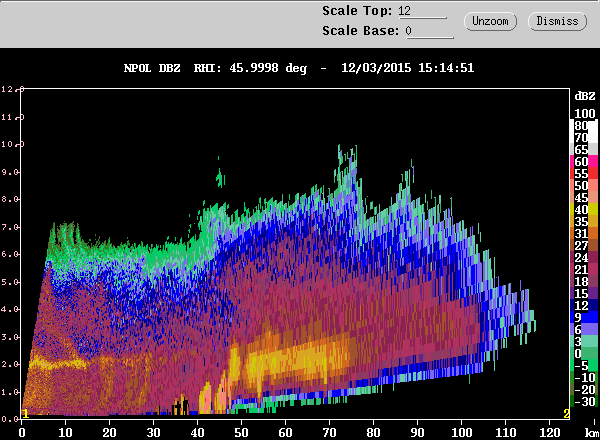
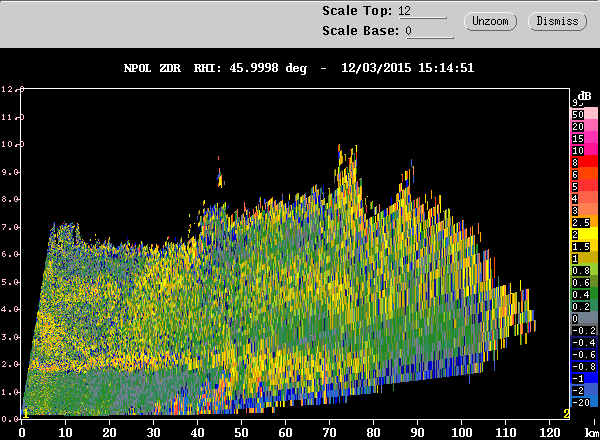
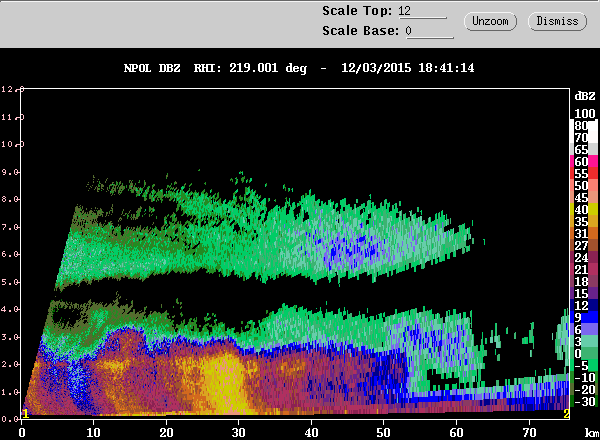
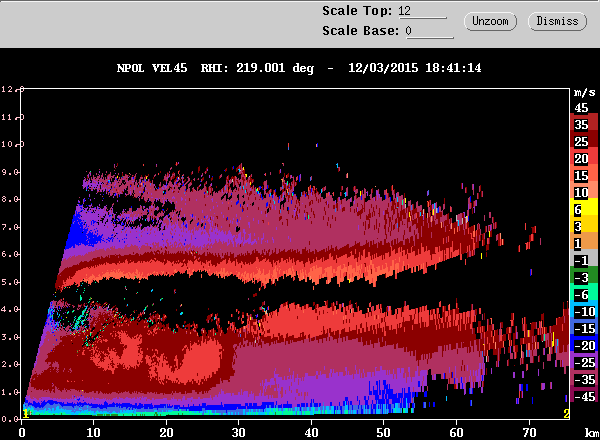
parallel to the Quinault Valley. The NPOL RHIs in Figure 10 show the
orographic enhancement of the precipitation occurring at
the time of the overpass. Note the lifting of the layer
of high wind passing over the terrain in the left panel.
The middle and right panels show the enhancement of the
reflectivity corresponding to the lifting over the
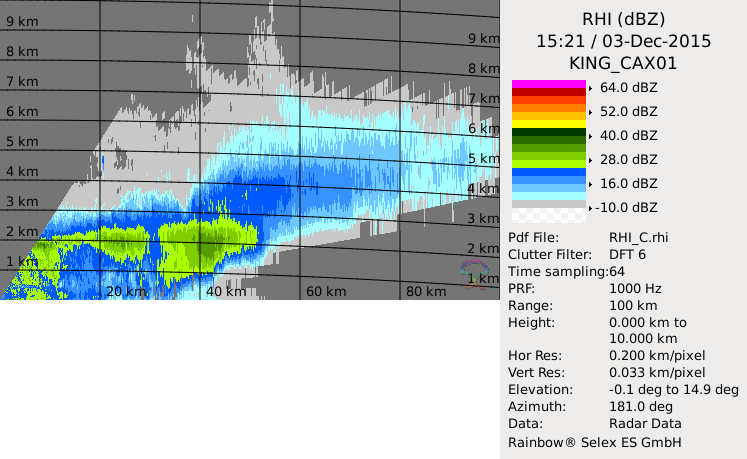
mountains. The reflectivity at the far ranges in the RHI
sector of the Environment Canada X-band (Figure 11, left) shows the deep
layer of ice particle precipitation extending over the
high terrain as it was advected across by the
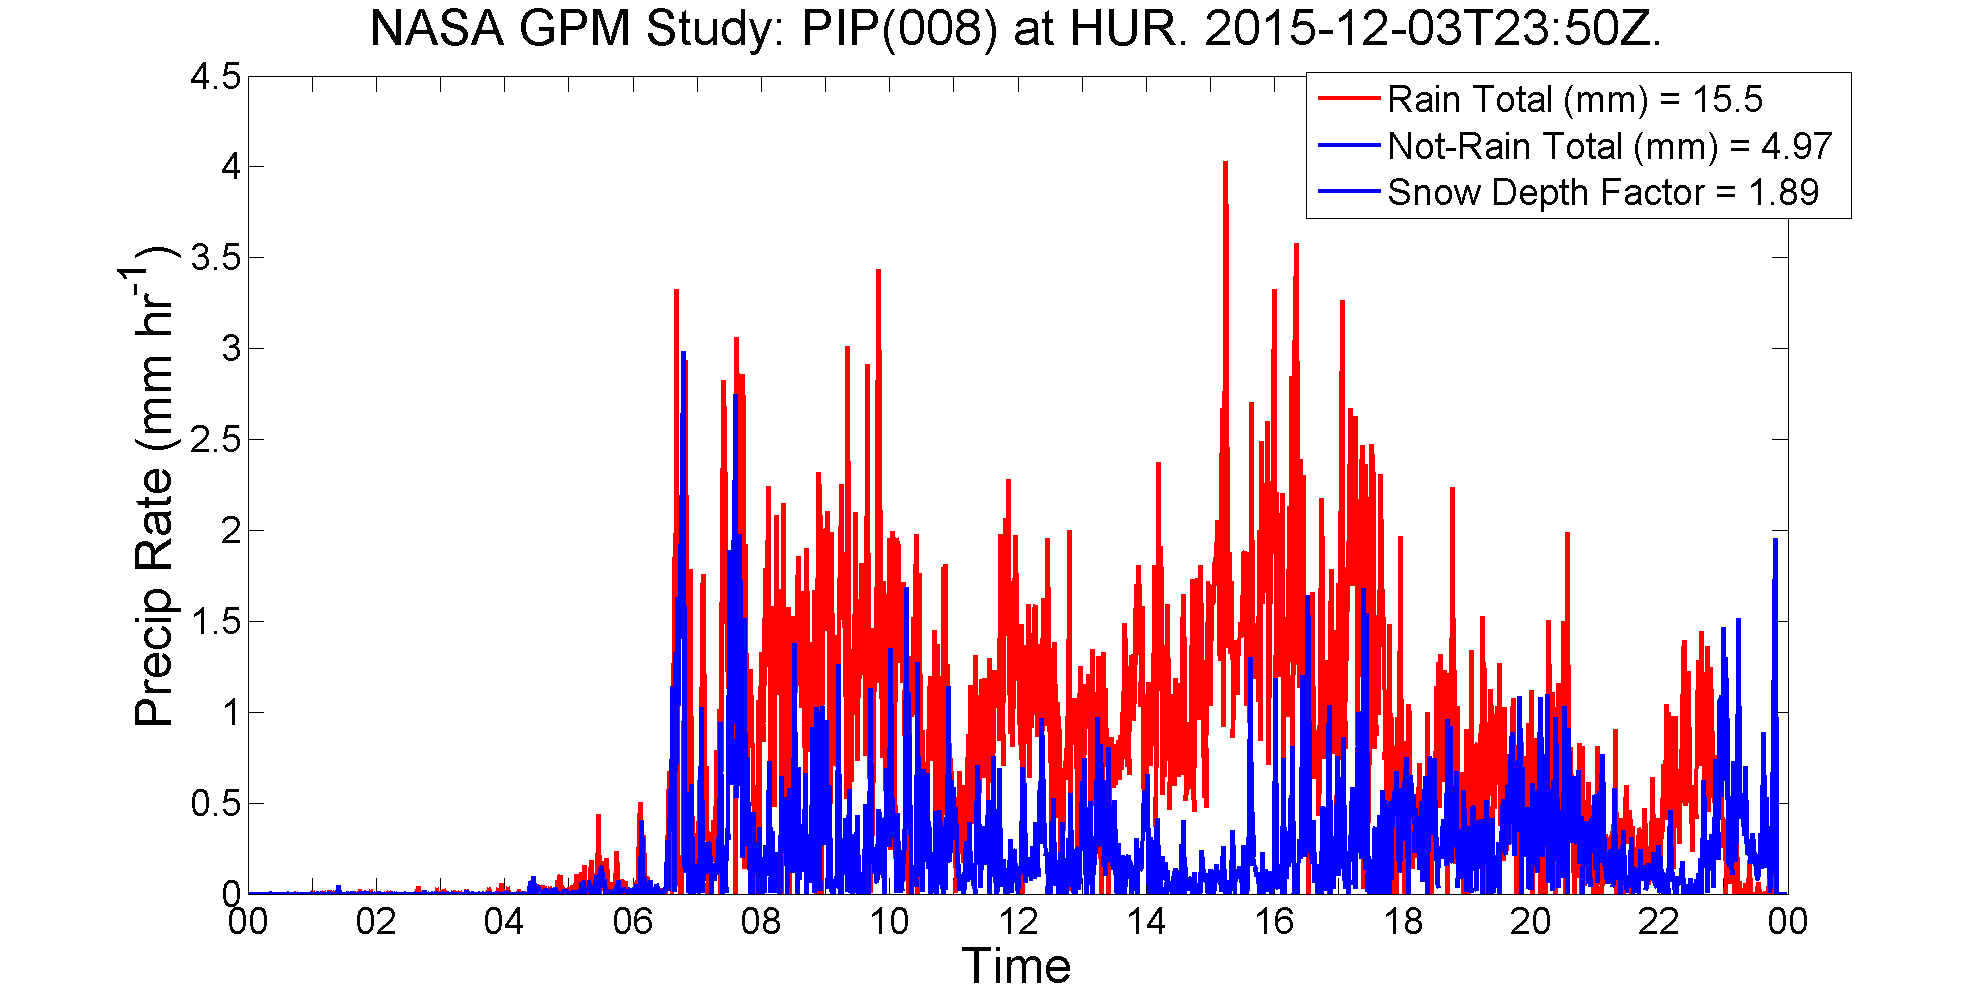
south-southwesterly winds. The PIP situated on Hurricane
ridge recorded mostly rain (and mixed rain and snow) for
most of day and then changing to mostly snow at the end
of the period (Figure
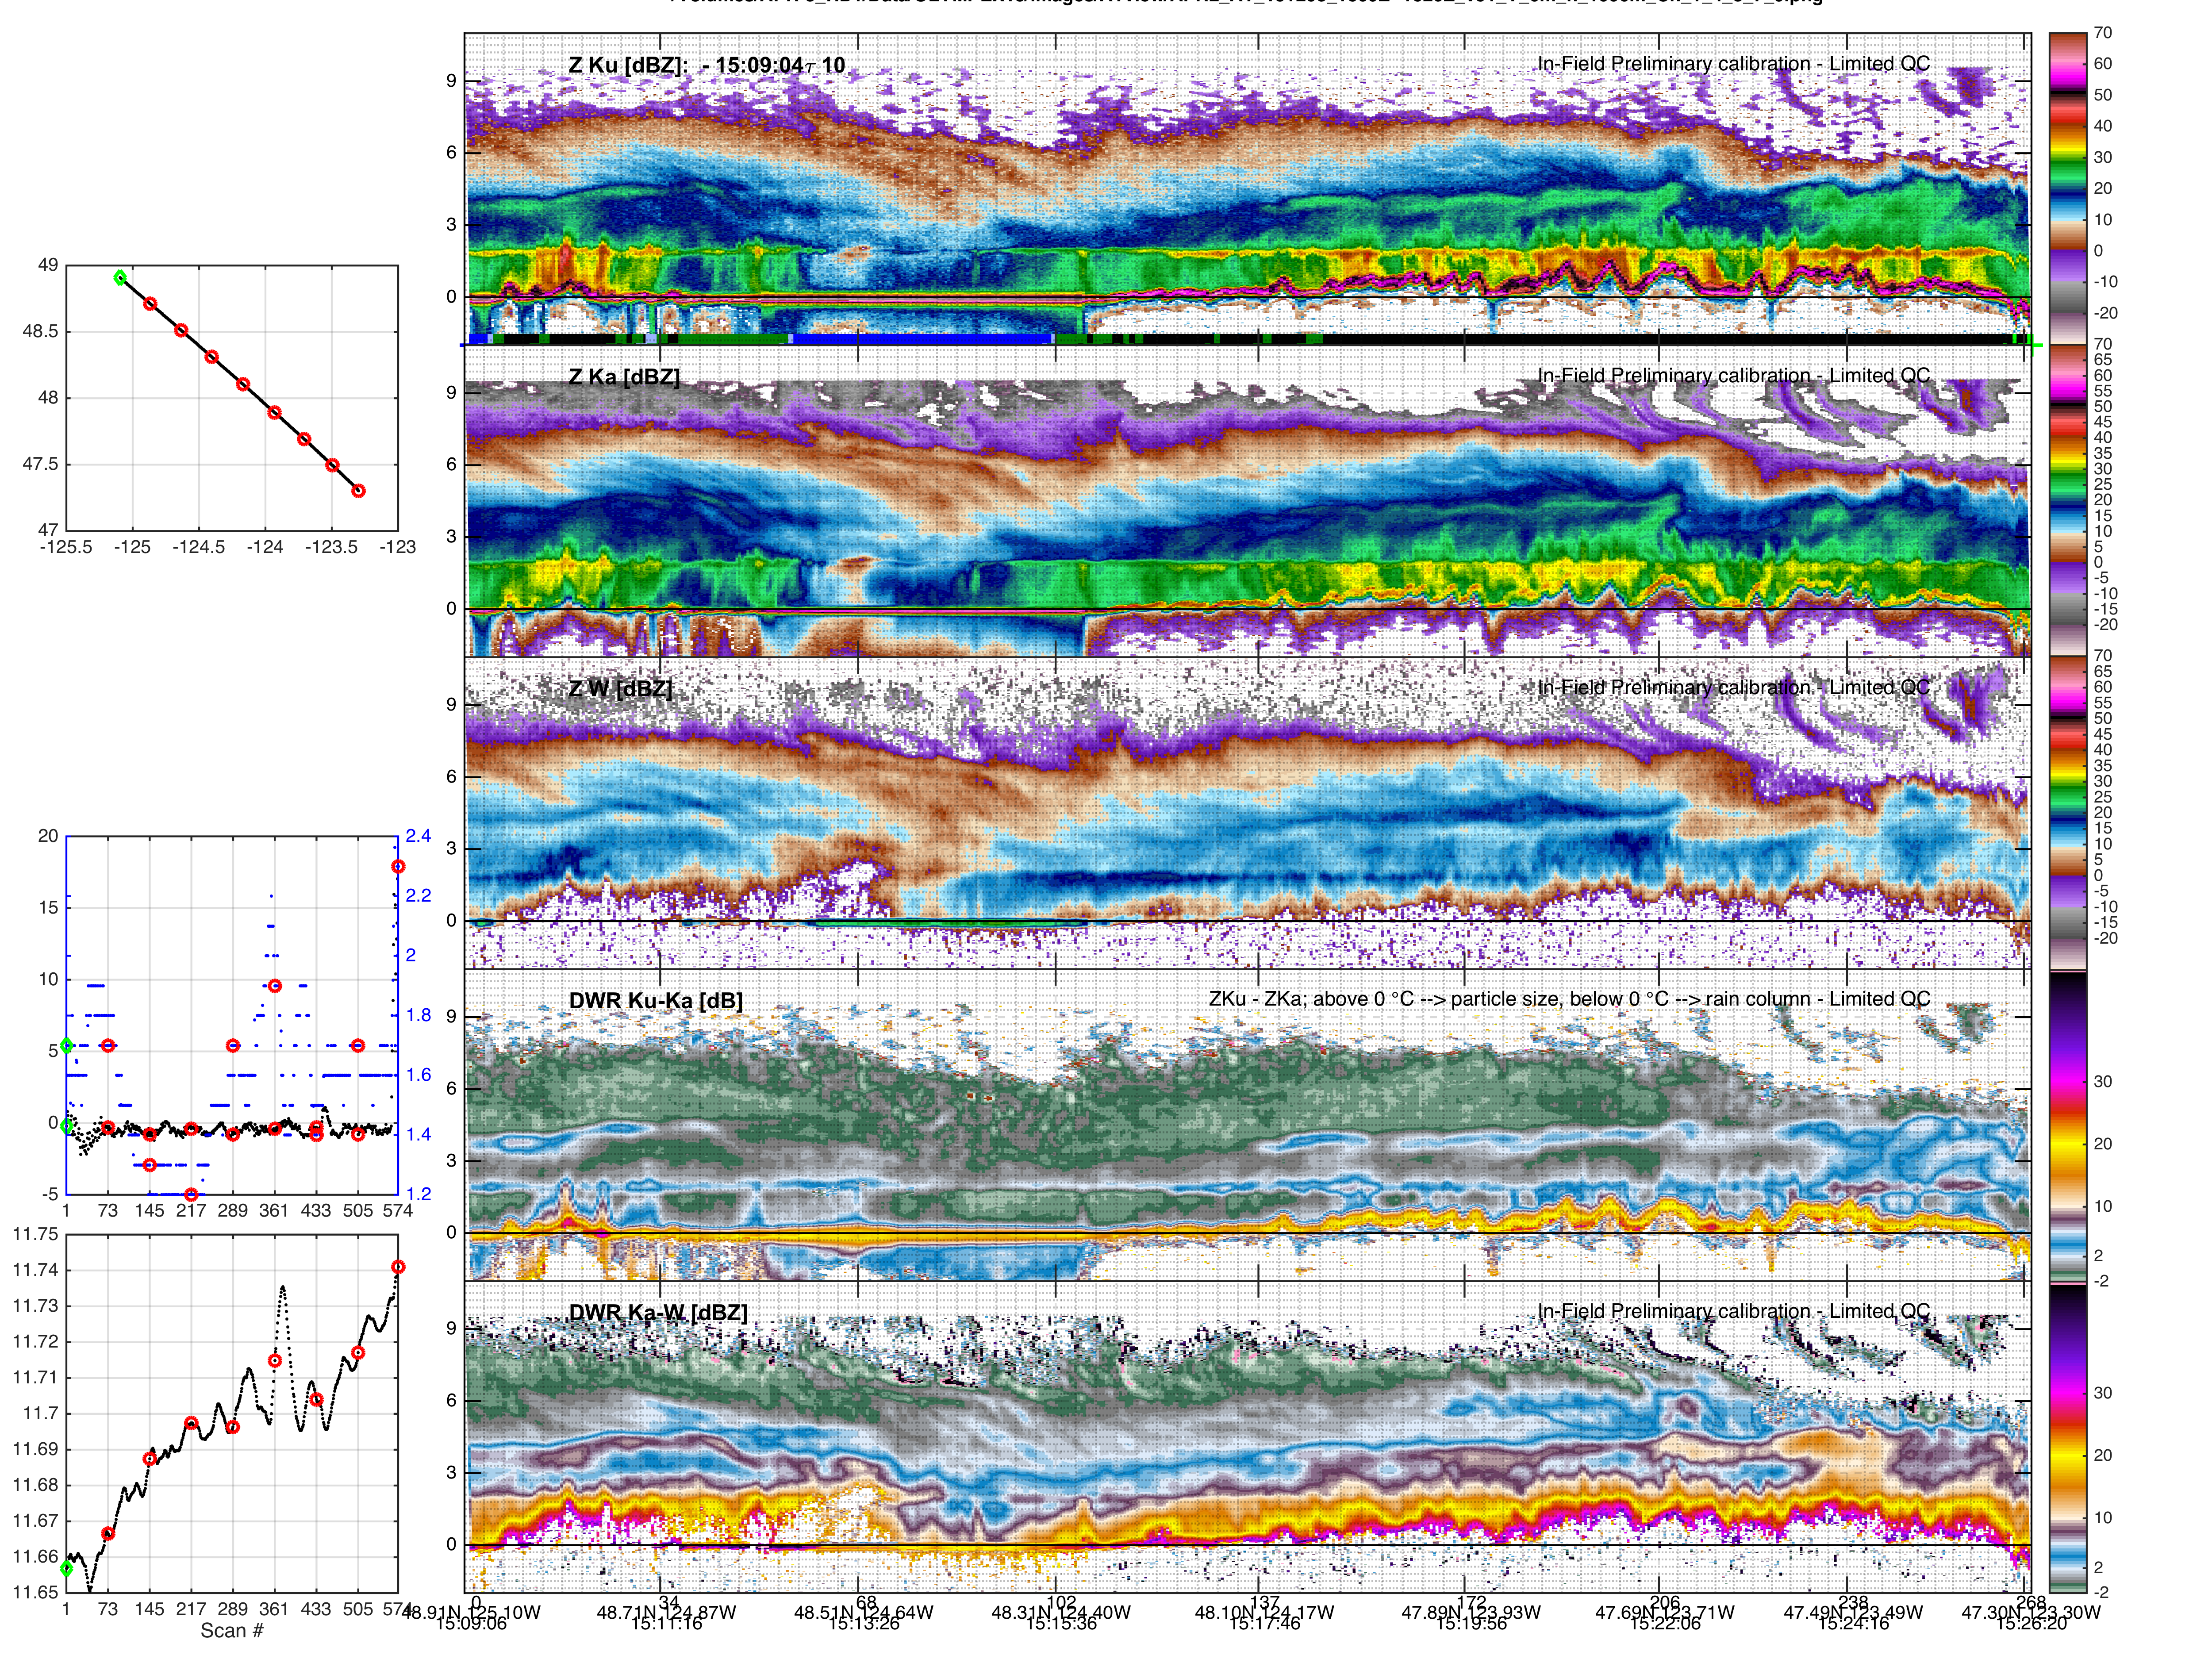
11, right). The APR2 radar aboard the
DC8 aircraft was also detecting the orographic
enhancement during the time of the overpass (Figure 12). Note the echo enhancement
over the terrain. The W-band radar was prominently
indicating the enhancement of the ice-particle echo in
the upper levels directly over the high terrain. The
vertical structure in the Ku-Ka and Ka-W DFR above the
melting level might indicate some growing aggregates
(where KuKa DFR gets up to about 5 dB) in a thin layer
near 4 km, and then a collapse in Ku-Ka DFR. Just below
that, the KaW DFR is larger, and the KuKa DFR goes back
to near 0 dBZ (indicating that the particles are likely
collapsing down in dimension, and Mie scattering at
Ku-Ka is reduced, but present at KaW). According to some
recent literature this behavior could be an indication
of the influence of riming on the particles in this
layer between the freezing level and 3 km. Consistent
with NPOL and APR2, the DOW radar in the Quinault Valley
was also showing the rising of the maximum velocity
layer over the terrain (Figure 13).
The tops of the clouds were sensed by the CPL lidar
aboard the ER2. The examples in Figure
14 were taken around the time of the GPM overpass.
They show the general cloud top level at about 11 km
when they aircraft was above continuous portions of the
cloud shield and highly variable tops over broken
segments of the trough's cloud system. Meanwhile, the
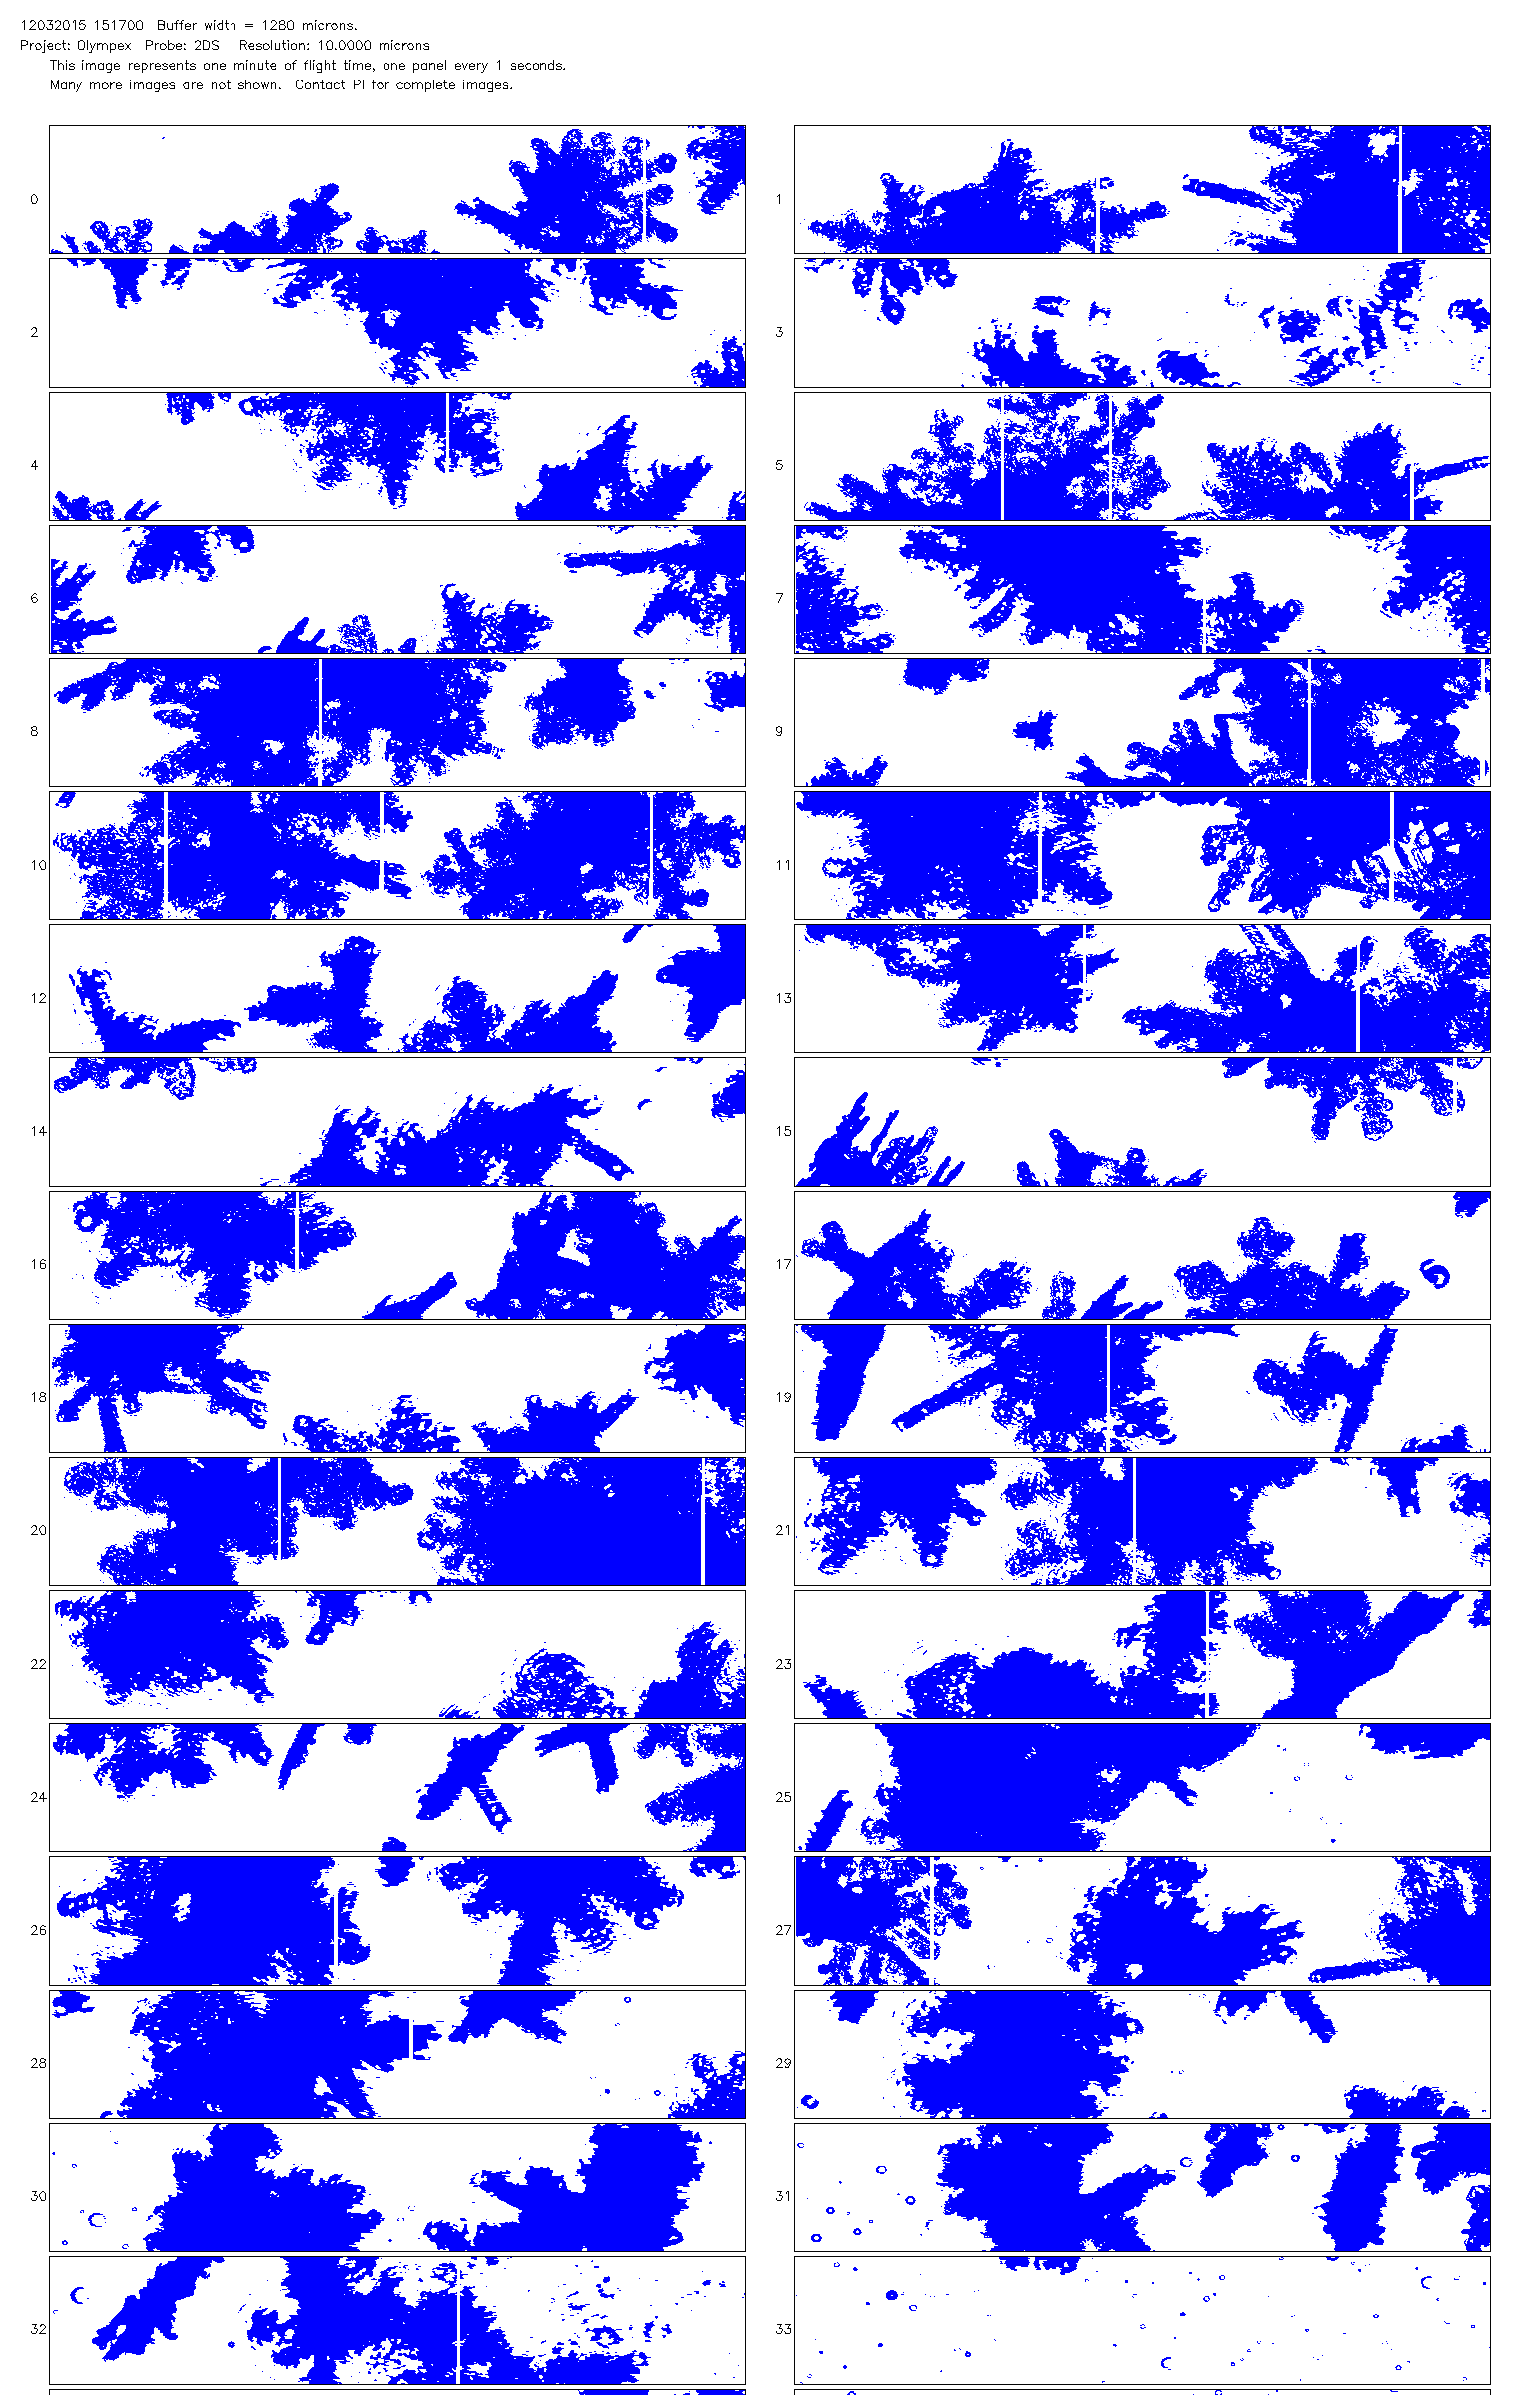
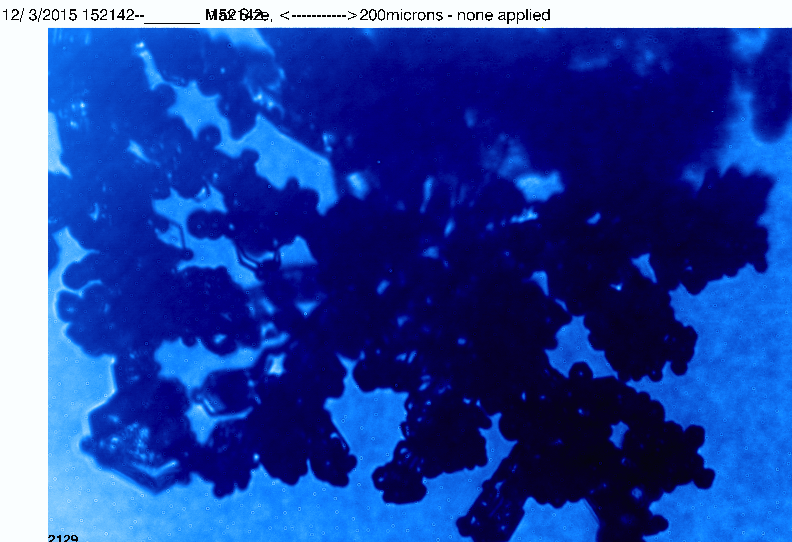
Citation was flying in cloud at various levels. Figure 15 shows examples of the
images of aggregate ice particles that were sampled. It
will require considerable further analysis to place
these images in context.
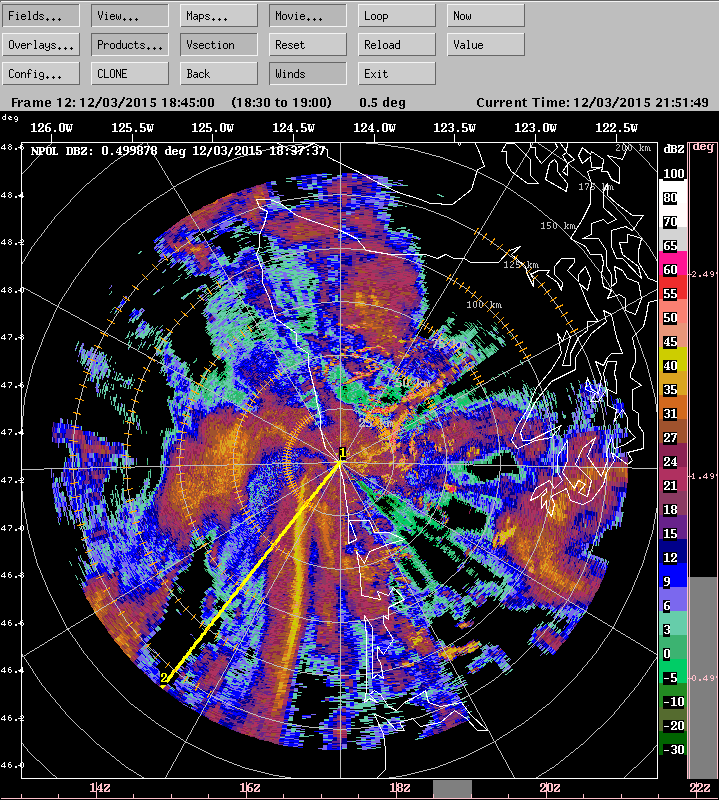
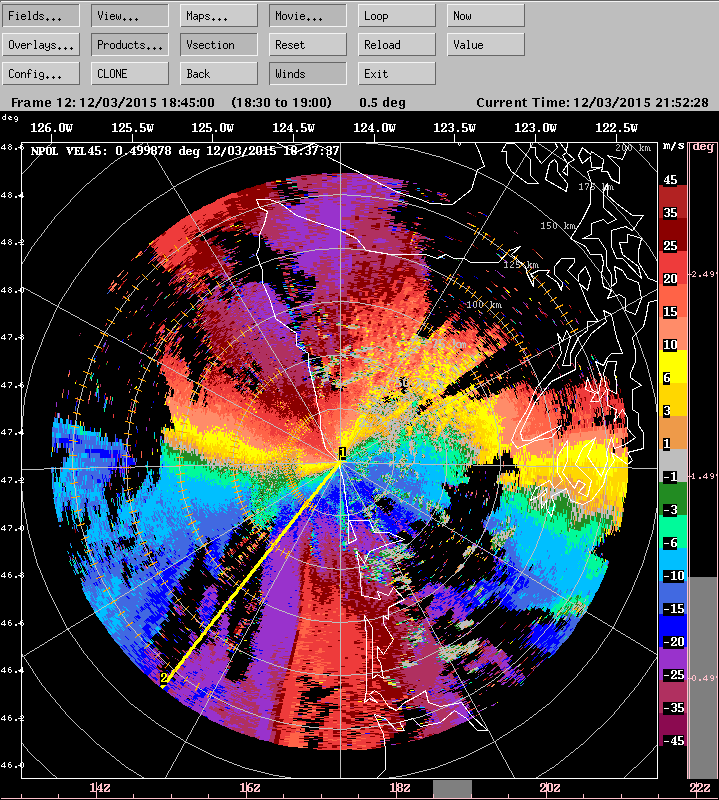
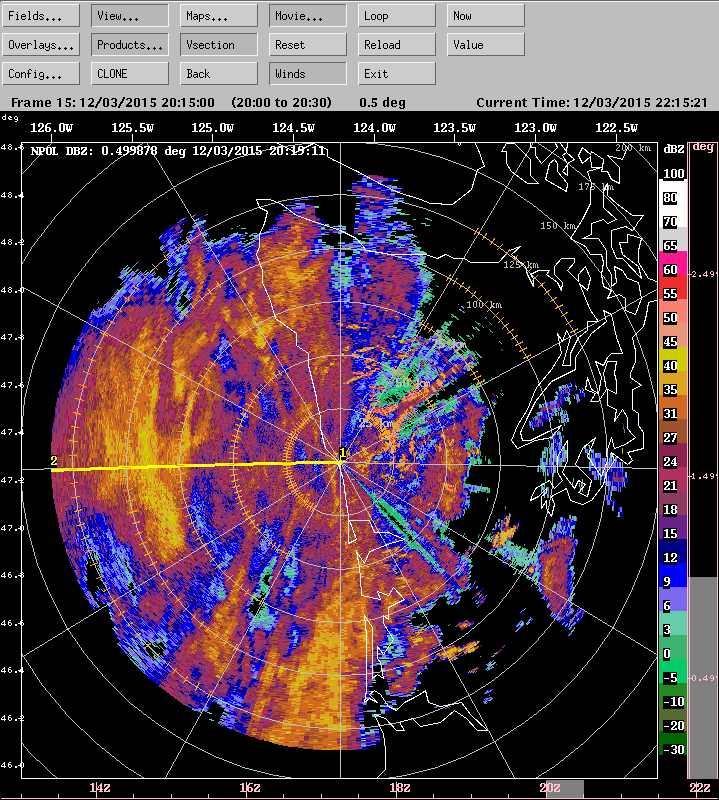
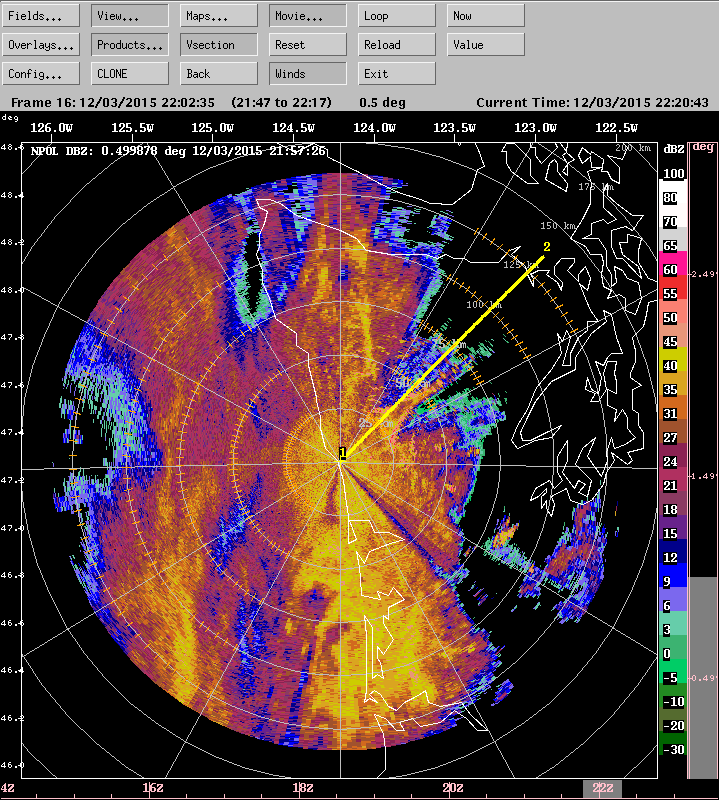
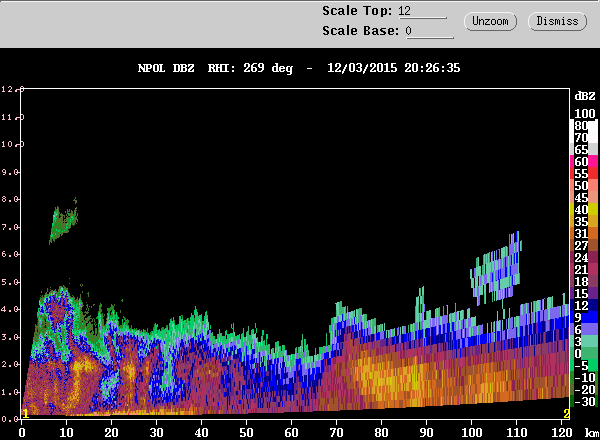
Long after the flights the OLYMPEX radars continued to
observe the complex precipitation evolution over the
region. Figure 16 shows an
unusual echo pattern that occurred at about 2000 UTC,
NPOL detected a line of strong echo associated with a
along a wind shift line in radial velocity. This echo
line was probably a fragment exhibiting weakly
frontogenetical properties. However, the feature was
extremely shallow, extending up to only about 4 km, and
it appeared to be a locally forced enhancement of the
stratiform precipitation; it exhibited no convective
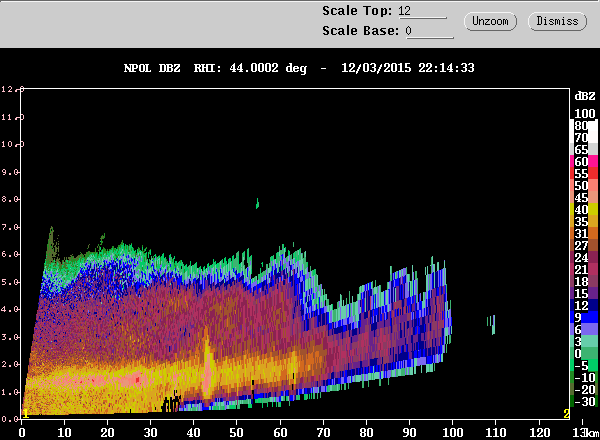
properties. As can be seen in the later panels of Figure 6, several cloud lines
were manifesting in the trailing part of the cloud
pattern of the trough. The left panels of Figure 17 show one of these
features to the west, and it was shallow, stratiform,
and somewhat patchy in its precipitation. The right
panels show another example, which was advected into the
NPOL region by the south-southwesterly flow. It was
somewhat deeper and had a very strong bright band at the
melting level. Over the sloping terrain it appeared to
have a lone convective element embedded, but the feature
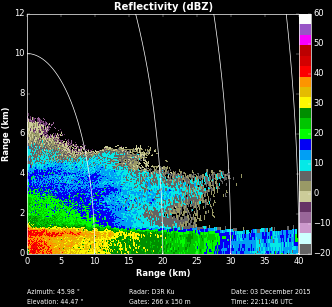
was almost entirely stratiform. Figure
18 shows how it looked in the D3R's Ku band
reflectivity.
|